
Wednesday, October 7, 2026 at 8:19 AM PDT
Why This Afternoon Matters More Than Usual for Your Mortgage Rate
Mortgage rates just hit their highest level since late 2023. Two things happening this afternoon — a large government bond sale and the release of the Federal Reserve's private meeting notes — will go a long way toward deciding whether they keep climbing. Here is what is going on, and what it costs in real dollars.
Where rates stand this morning
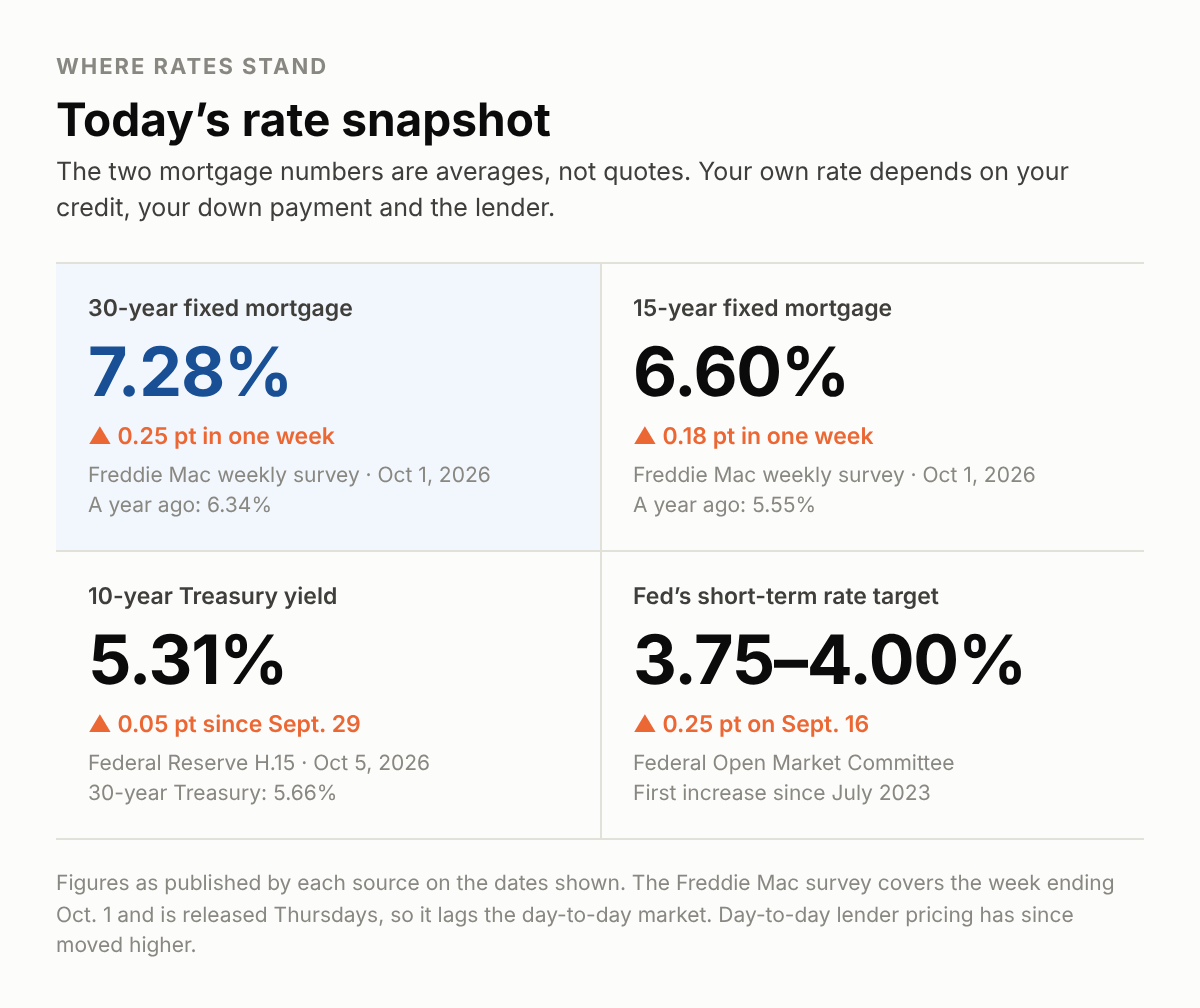
Figure 1. Sources: Freddie Mac Primary Mortgage Market Survey, released October 1, 2026; Federal Reserve H.15 Selected Interest Rates, released October 6, 2026 (data through October 5); Federal Open Market Committee statement, September 16, 2026.
Freddie Mac's weekly survey put the average 30-year fixed mortgage at 7.28% for the week ending October 1. That is a quarter of a percentage point higher than the week before, and nearly a full point above the 6.34% average of a year ago. Fox Business reported it is the highest weekly average since the week of November 22, 2023, when the survey read 7.29%.
One caveat: that survey comes out Thursdays and covers rates offered over the previous several days, so it runs behind the live market. Mortgage News Daily, which reads actual lender rate sheets each business day, had the 30-year fixed at 7.56% on Tuesday, October 6. If you are shopping today, the rate-sheet number is closer to what you will actually be quoted.
Why rates keep climbing
Mortgage rates do not track the Fed's short-term rate directly. They move with the 10-year Treasury yield and the mortgage-bond market built on top of it — which is also why Fed decisions still matter, just indirectly. The Federal Reserve's own H.15 report shows the 10-year Treasury yield at 5.31% on October 5, up from 5.26% on September 29. The 30-year Treasury finished at 5.66%.
Bond investors have been selling. When they sell, yields rise, and mortgage rates follow a few days later. Three things are pushing them:
Energy prices. Inflation overall ran at 3.4% over the 12 months through August, according to the Bureau of Labor Statistics. But strip out food and energy and the “core” rate was just 2.4%. The gap is almost entirely fuel: gasoline was up 27.4% over the year, and energy as a whole up 16.3%. Brent crude topped $103 a barrel on October 1, Fortune reported, on tension in the Middle East.
Businesses passing costs along. The Institute for Supply Management's September services report, released October 5, showed its prices index at 74.0 — up 1.4 points from August and the highest reading since July 2022.
The Fed turning around. On September 16 the Fed raised its short-term rate a quarter point, to 3.75%–4.00% — a unanimous 12–0 vote and the first increase since July 2023. The statement was blunt: “Inflation remains elevated… The Committee will deliver price stability.”
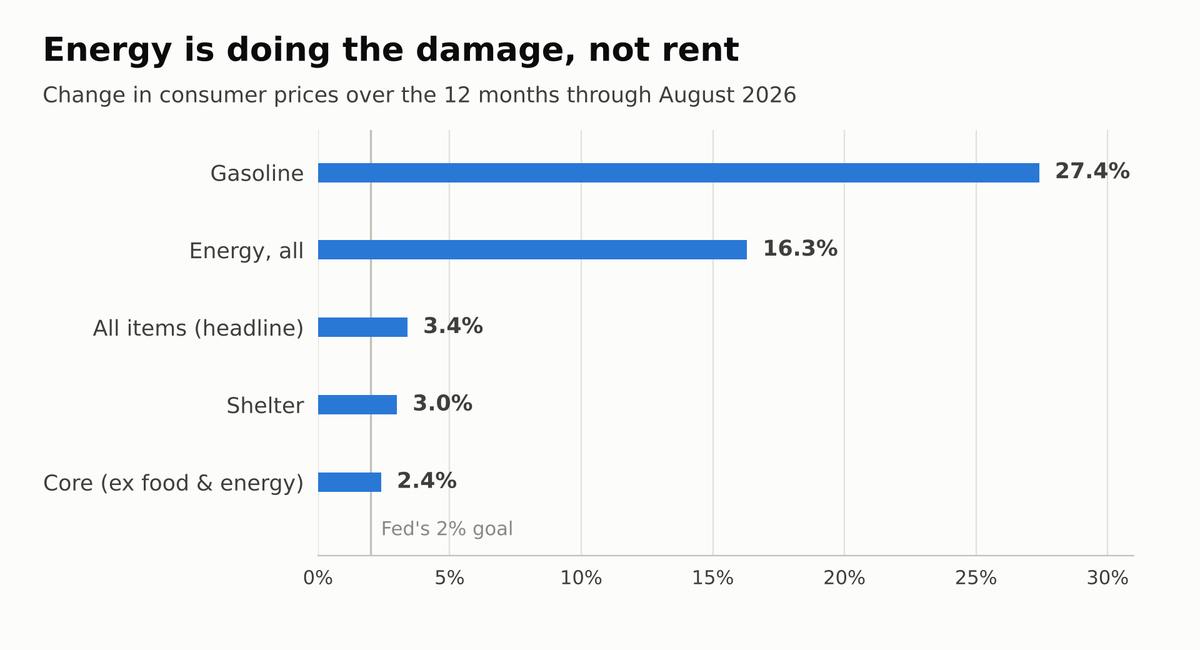
Figure 2. Source: U.S. Bureau of Labor Statistics, Consumer Price Index for August 2026, released September 11, 2026. Next release: September CPI on October 14, 2026.
That chart is the part most people miss. Housing costs inside the inflation report are behaving — shelter rose 3.0% over the year. The problem is at the gas pump.
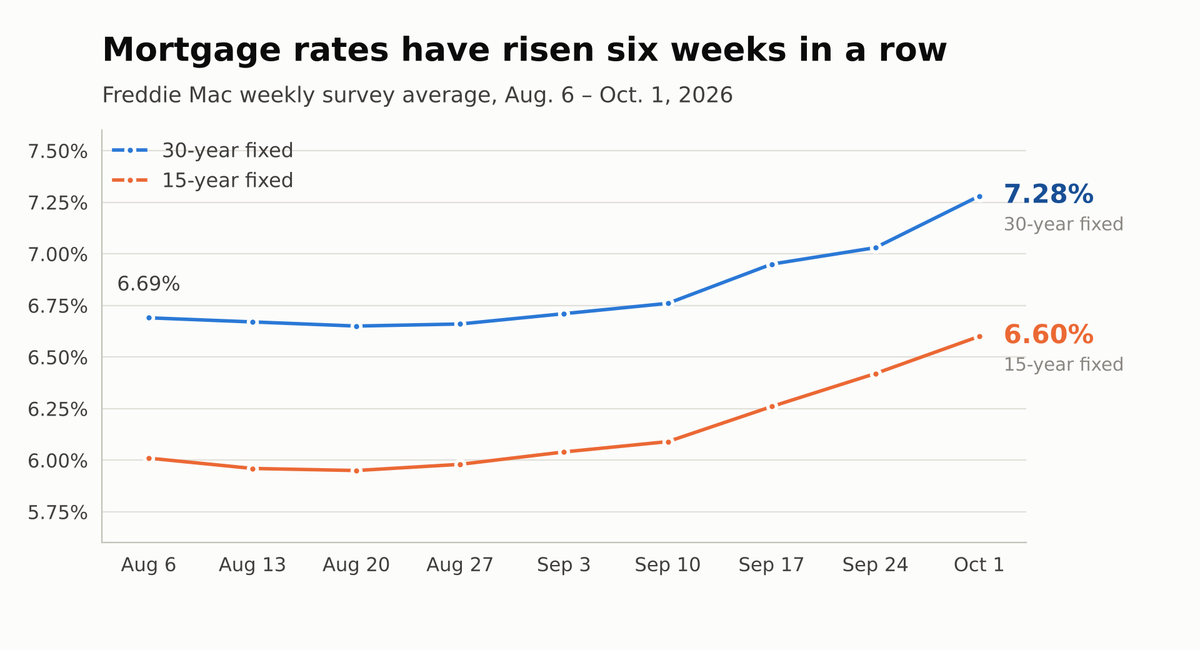
Figure 3.Source: Freddie Mac Primary Mortgage Market Survey weekly releases, August 6 through October 1, 2026.
What it costs in dollars
Percentages are abstract. Payments are not.
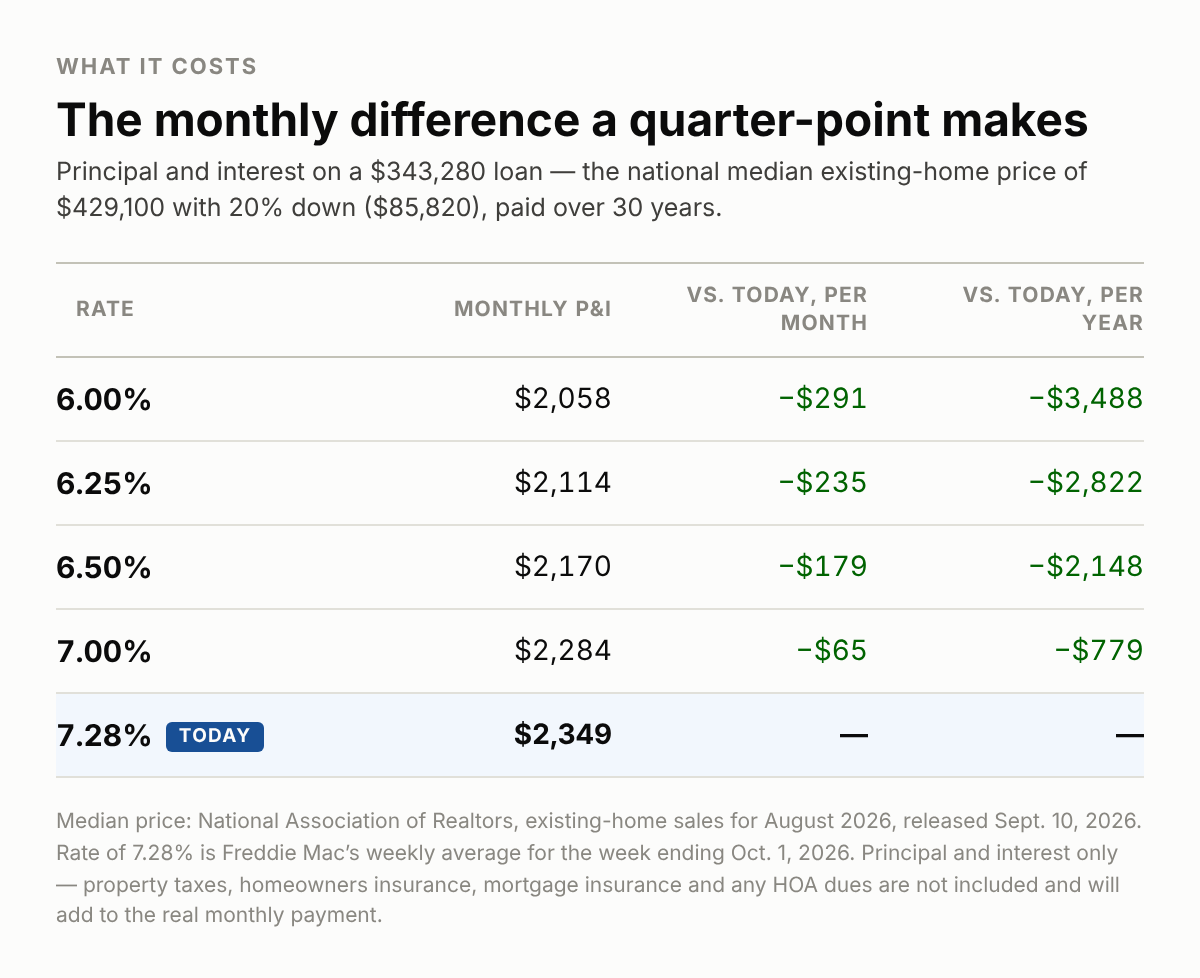
Figure 4. Sources: National Association of Realtors, Existing-Home Sales for August 2026, released September 10, 2026 (median price); Freddie Mac Primary Mortgage Market Survey, released October 1, 2026 (rate). Payment math is the author's calculation.
On the national median existing-home price of $429,100 with 20% down — a loan of $343,280 — every quarter-point costs roughly $56 a month, or about $670 a year. Moving from 6.50% to today's 7.28% is $179 more a month, which is $2,148 a year, every year, for as long as you hold the loan.
Those figures are principal and interest only. Taxes, insurance, mortgage insurance and HOA dues come on top — often several hundred dollars more.
The housing market, briefly
Higher rates are cooling sales without crushing prices. The National Association of Realtors reported existing-home sales at an annual pace of 3.98 million in August, down 2.0% from July and 1.2% from a year earlier. The median price still rose 1.6%.
The real change is in supply. Inventory reached 1.62 million homes, or 4.9 months' worth at the current sales pace — which NAR chief economist Lawrence Yun noted is “its highest level in over ten years.” Homes took a median of 31 days to sell.
New construction is the softer market. The Census Bureau reported new single-family home sales at an annual rate of 684,000 in August — up 6.4% from July, but with 8.5 months of supply sitting on the market. The median new-home price was $393,700, which Census puts 5.8% below a year earlier, though it cautions that change is within its margin of error. Builders are cutting prices and buying down rates to move inventory.
For a buyer, that is the trade-off right now: the worst financing in three years, paired with the most choice and the most negotiating room in a decade.
What to watch
Today. The Treasury sells $39 billion of 10-year notes, per Charles Schwab's market update, at the usual 1 p.m. Eastern. Tuesday's 3-year sale drew solid enough demand, but it cleared at 4.932% — the highest yield on that security since May 2006. Today's is the bigger test. A strong sale helps rates. A weak one does not.
Today, 2 p.m. Eastern. The Fed releases the minutes of its September 15–16 meeting — the detailed notes from the session where it raised rates. Investors will read them for how close the committee is to another increase.
Thursday. A 30-year Treasury bond auction, and Freddie Mac's next weekly survey at noon Eastern. Given where daily lender pricing has been, expect a number above 7.28%.
October 14. The September inflation report from the Bureau of Labor Statistics. This is the big one before the Fed's next meeting on October 27–28.
On that meeting: futures traders put the odds at roughly 78% the Fed holds and 22% it raises again, per CME Group's FedWatch tool as reported by Benzinga on October 6. Those hike odds dropped sharply after the September jobs report landed on October 2 — employers added just 29,000 jobs, unemployment ticked to 4.2%, and July was revised to an outright loss of 10,000 jobs.
What I would do
If you are buying: do not wait for a better rate before you shop. Nobody knows where this goes, and meanwhile you have more homes to choose from and more room to negotiate than buyers have had in years. Ask sellers and builders about paying for a rate buydown — in this market, many will.
If you are under contract: talk to me about locking today rather than floating into this afternoon. The downside of locking and being wrong is small. The downside of floating into a bad bond auction is not.
If you already own: refinancing is not the move at these levels for most people. But if you are carrying credit card or other high-rate debt, the math on a cash-out may still work. And if you bought when rates were above 7%, tell me — I will set a watch on your loan and call you the day a refinance makes sense.
If someone quoted you a rate more than a week ago: that number is stale. Get a fresh one before you decide anything.
Rates have moved almost two-thirds of a point in six weeks. The right response is not panic — it is a current number and a plan. Call me and we will run yours.
References
Freddie Mac. Primary Mortgage Market Survey — Mortgage Rates Average 7.28%. October 1, 2026. https://www.freddiemac.com/pmmsFreddie Mac. Primary Mortgage Market Survey weekly archive (Aug. 6 – Oct. 1, 2026). accessed October 7, 2026. https://www.freddiemac.com/pmms/pmms_archives
Board of Governors of the Federal Reserve System. H.15 Selected Interest Rates (Daily). released October 6, 2026; data through October 5, 2026. https://www.federalreserve.gov/releases/h15/
Federal Open Market Committee. FOMC Statement. September 16, 2026. https://www.federalreserve.gov/newsevents/pressreleases/monetary20260916a.htm
Board of Governors of the Federal Reserve System. FOMC Meeting Calendars and Information. minutes of the September 15–16, 2026 meeting released October 7, 2026. https://www.federalreserve.gov/monetarypolicy/fomccalendars.htm
U.S. Bureau of Labor Statistics. Consumer Price Index — August 2026. September 11, 2026. https://www.bls.gov/news.release/cpi.htm
U.S. Bureau of Labor Statistics. The Employment Situation — September 2026. October 2, 2026. https://www.bls.gov/news.release/empsit.nr0.htm
National Association of Realtors. Existing-Home Sales — August 2026. September 10, 2026. https://www.nar.realtor/newsroom/nar-existing-home-sales-report-shows-2-0-decrease-in-august
U.S. Census Bureau and U.S. Dept. of Housing and Urban Development. Monthly New Residential Sales — August 2026. September 24, 2026. https://www.census.gov/construction/nrs/pdf/newressales.pdf
Institute for Supply Management. Services PMI at 54.9% — September 2026 Services ISM Report On Business. October 5, 2026. https://www.prnewswire.com/news-releases/services-pmi-at-54-9-september-2026-ism-services-pmi-report-302898421.html
Fox Business. Mortgage rates rise to 7.28%: Freddie Mac. October 1, 2026. https://www.foxbusiness.com/economy/mortgage-rates-10-1-2026
Mortgage News Daily. Mortgage Rates — daily rate index. October 6, 2026. https://www.mortgagenewsdaily.com/mortgage-rates
Fortune. Oil prices, October 1, 2026 (Brent crude at $103.86 a barrel). October 1, 2026. https://fortune.com/article/price-of-oil-10-01-2026/
Charles Schwab. Stock Market Update. October 7, 2026 (October 7 auction of $39 billion in 10-year notes; October 6 three-year note result). https://www.schwab.com/learn/story/stock-market-update-open
Benzinga. October Fed hike odds fall to 21.6%. October 6, 2026, citing the CME Group FedWatch Tool. https://www.benzinga.com/markets/economic-data/26/10/62185721/jim-cramer-says-interest-rates-can-fall-too-as-october-fed-hike-odds-fall-to-21-6-heres-what-traders-are-betting-on
About the figures. All four figures were built from the published figures in the sources above. They are original work, contain no AI-generated imagery, and are free for you to reproduce and re-send under your own name. Payment calculations in Figure 4 are standard amortization math on the median price and rates cited. The one figure drawn from a non-primary source is the 7.56% daily rate-sheet index from Mortgage News Daily, a commercial index rather than a government or GSE release, labeled as such in the text.