
Monday, August 31, 2026 at 10:10 AM PDT
The Fed just changed the question from “when do they cut?” to “do they hike?”
Fed Chair Kevin Warsh spent Friday morning in Jackson Hole telling the world that inflation still isn’t behaving. Bond traders heard him. Over the weekend the odds of the Fed raising rates on September 16 went from a long shot to better than a coin flip — which quietly rewrites the plan for anyone waiting on a lower rate before they buy or refinance.
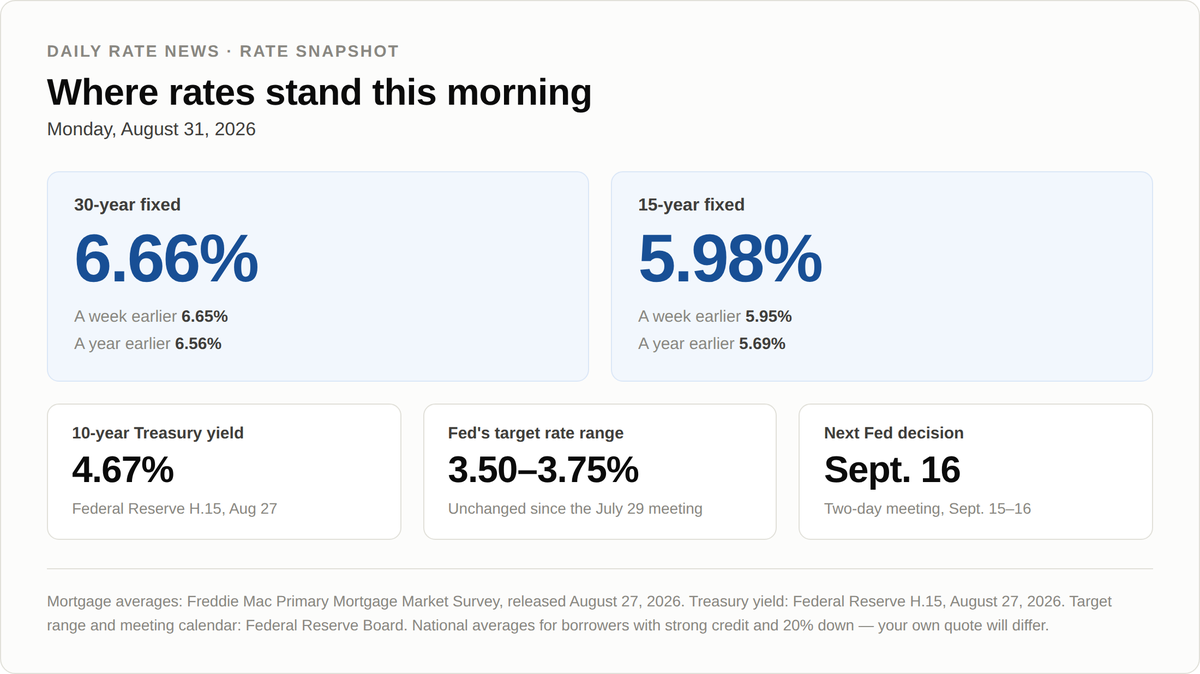
Figure 1. Rate snapshot. Mortgage averages from Freddie Mac’s Primary Mortgage Market Survey, released August 27, 2026. Treasury yield from Federal Reserve H.15, August 27, 2026.
What happened Friday
Every August the Kansas City Fed hosts a conference in Jackson Hole, Wyoming, where the Fed Chair gives a speech markets pick apart word by word. On Friday, August 28, Chair Kevin Warsh delivered his, titled “In Our Time.”
He announced no decision. He simply told everyone which number he is staring at. The Fed’s preferred inflation gauge, the PCE price index, is up 3.7% over the past 12 months, he noted — and running at an annualized 4.1% over the past six. The Fed’s goal is 2%. In his words, “We must be confident that underlying inflation is moving to our objective, clearly and at sufficient speed.” He added that this summer’s better-than-expected readings “do not tell me that underlying trends have meaningfully improved.”
He closed the door on guessing his next move — “I stand here today committed to a discipline, not to a decision” — but the message landed anyway. By Friday’s close, the CME FedWatch tool, which reads the odds out of interest-rate futures contracts, showed roughly a 56% chance the Fed raises rates a quarter point at its September 15–16 meeting, as reported by CNBC. A week earlier those odds sat near 40%. CoinDesk put the reading at 58% early Monday.
Why this pushes mortgage rates the wrong way
Mortgage rates don’t follow the Fed’s rate directly. They track the 10-year Treasury yield — the return investors demand for lending the government money for a decade. When investors expect inflation to stay high, they demand more, and that yield rises. Mortgage rates ride along, usually about 2.5 to 3 percentage points above it.
The 10-year finished Thursday, August 27 at 4.67% (Federal Reserve H.15), then rose again Friday after the speech, closing near 4.73% by several market accounts. The mechanism: a hawkish Fed chair means higher yields, and higher yields mean higher mortgage quotes a day or two later.
This wasn’t out of nowhere. At the July 28–29 meeting the Fed held its target range at 3.50%–3.75%, but three officials dissented in favor of raising it. The minutes, released August 19, put it plainly: “several participants favored an increase of 25 basis points in the target range at this meeting.”
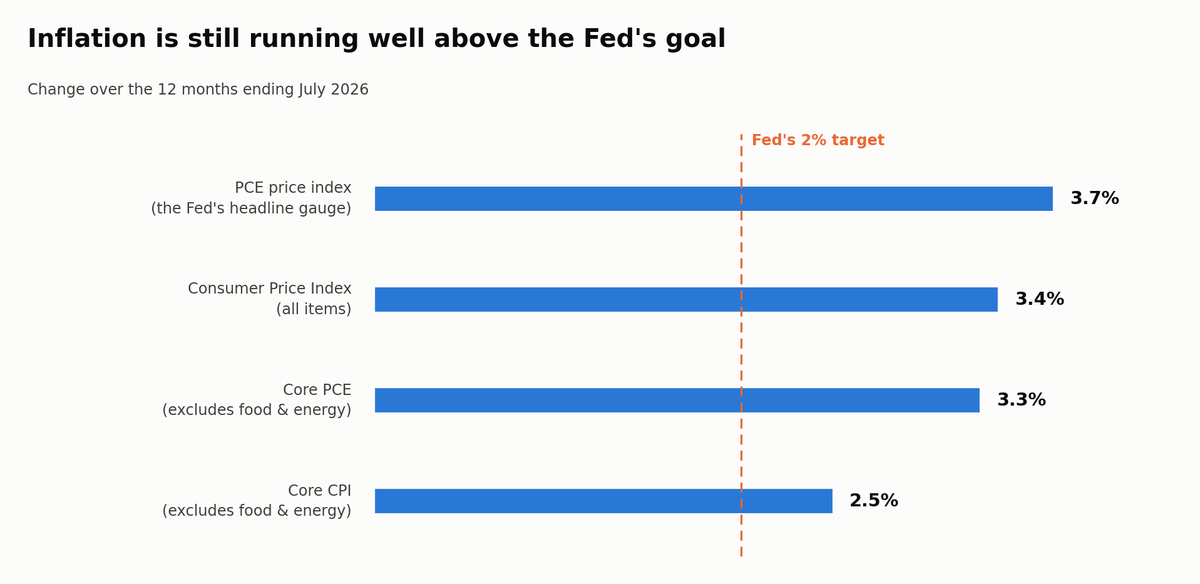
Figure 2. Twelve-month inflation through July 2026. PCE figures from the Bureau of Economic Analysis, Personal Income and Outlays, released August 26, 2026. CPI figures from the Bureau of Labor Statistics, released August 12, 2026.
Freddie Mac’s weekly survey put the 30-year fixed at 6.66% on August 27 and the 15-year at 5.98% — barely changed from the week before, but that survey closed before the Jackson Hole speech. Chief economist Sam Khater said rates “changed little this week averaging 6.66%,” in an economy that “remains resilient, demonstrated by steady consumer spending and rising household incomes.” Resilient is good news for your job. It is not good news for your rate.
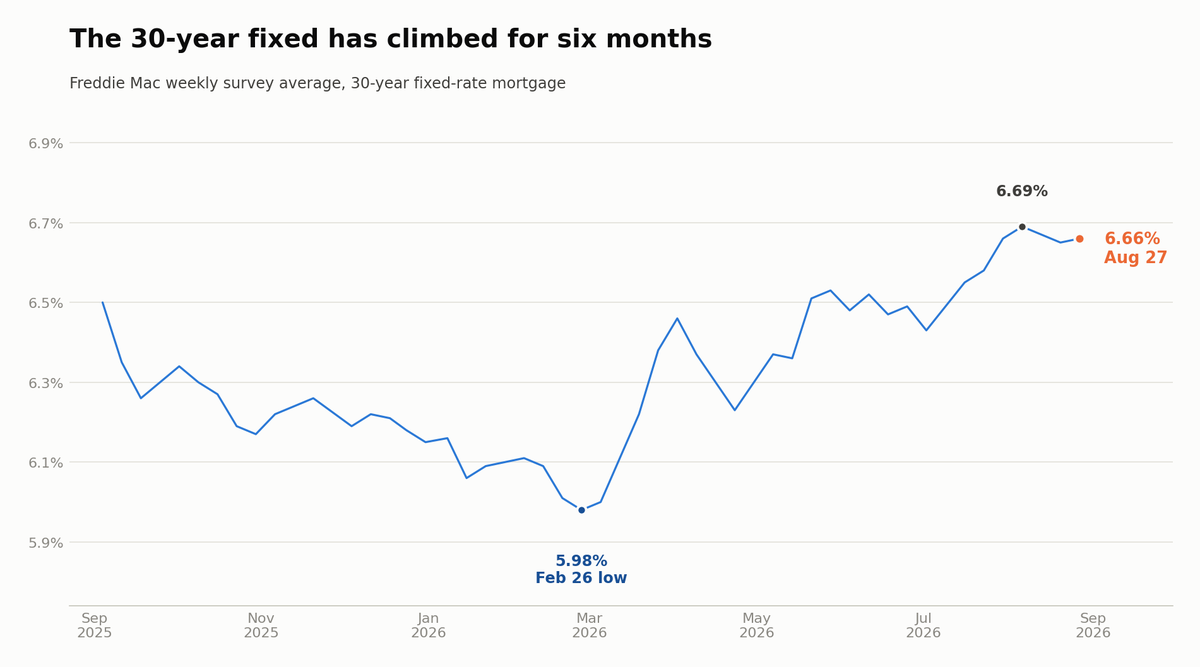
Figure 3. Freddie Mac Primary Mortgage Market Survey, 30-year fixed weekly averages, September 4, 2025 through August 27, 2026.
What it costs in dollars
Here is what matters at the closing table. Take the national median existing-home price — $434,100 in July, per the National Association of Realtors — put 20% down, and finance $347,280 over 30 years.
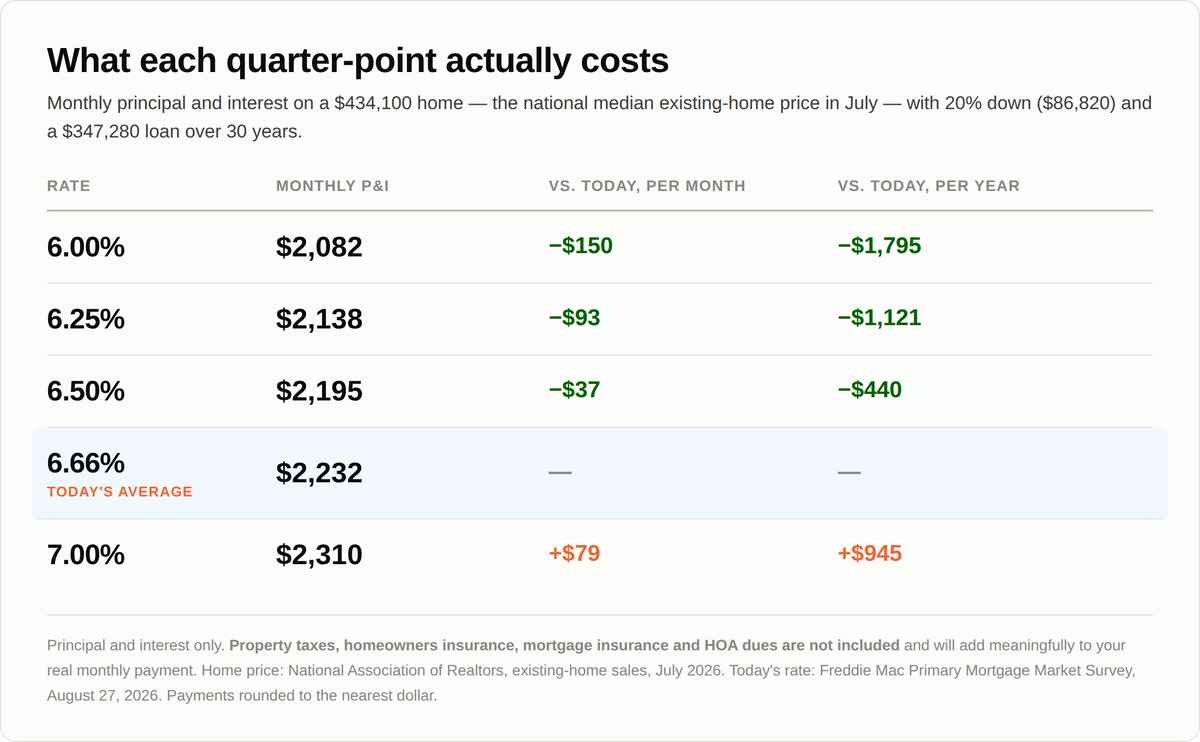
Figure 4. Original calculation. Home price from the National Association of Realtors, existing-home sales, July 2026. Rate from Freddie Mac’s Primary Mortgage Market Survey, August 27, 2026.
At today’s 6.66%, principal and interest run about $2,232 a month. If rates drift to 7.00%, that becomes $2,310 — an extra $79 a month, or $945 a year, for the exact same house. Go the other way to 6.00% and you’d save $150 a month.
So the whole argument is roughly $150 either side of today. Real money — but not the difference between affording a house and not. Worth keeping in proportion.
The housing market underneath all this
Two different stories are running side by side.
Existing homes are holding up. Sales ran at a 4.06 million annual pace in July, down 1.7% from June but up 0.7% from a year ago (NAR). The median price rose 2.0% over the year to $434,100. Inventory sits at 1.54 million homes, a 4.6-month supply, and homes are going under contract in about 29 days. NAR’s Lawrence Yun called sales “remarkably stable, even amid the rising mortgage rate environment of the past few months.”
New construction is struggling. New single-family home sales fell 10.5% in July to a 607,000 annual pace, per the Census Bureau’s August 25 release. The median new-home price was $393,800, and builders hold a 9.6-month supply.
That gap is your opening. Builders sitting on nearly ten months of unsold inventory have a strong reason to negotiate — often through a rate buydown, where the builder pays the lender up front to lower your interest rate. Ask.
What to watch this week
Friday, September 4, 8:30 a.m. Eastern — the August jobs report.The last major data before the Fed meets, and the one thing that could undo Friday’s repricing.
Why it matters so much: the labor market has been wobbling. July payrolls actually fell by 23,000, and the Bureau of Labor Statistics revised May and June down by a combined 103,000 jobs. Unemployment held at 4.1%.
That leaves the Fed squeezed. Inflation says tighten; the job market says don’t. A weak August report makes a September hike much harder to justify, and rates would likely ease. A strong one and the hawks win the argument.
What I’d do
If you’re closing in the next 30 days, lock. Risk is tilted toward higher rates, and Friday’s jobs report is a coin flip you don’t need to gamble on days before funding.
If you’re 45 or more days out, you have room to float — but ask me to set a trigger so we lock automatically if rates cross a line you’re comfortable with.
If you’re waiting for 5.99% before you buy, reconsider. Rates bottomed at 5.98% in February and have climbed most of the six months since. Nobody, the Fed included, knows where they go next. Buy the payment you can carry today, and treat a future refinance as a bonus rather than a rescue.
If your rate starts with a 7, let’s run the numbers. Even a drop to 6.66% is worth checking, and I’ll tell you honestly whether the closing costs pay for themselves in the time you plan to stay.
Questions on any of this? Just reply — I read every one.
REFERENCES
1. Freddie Mac. Primary Mortgage Market Survey: Mortgage Rates Hold Steady. Released August 27, 2026. https://www.freddiemac.com/pmms
2. Board of Governors of the Federal Reserve System. H.15 Selected Interest Rates (Daily).Data through August 27, 2026. https://www.federalreserve.gov/releases/h15/
3. Kevin Warsh. In Our Time — keynote remarks, 2026 Jackson Hole Economic Policy Symposium. August 28, 2026. https://www.federalreserve.gov/newsevents/speech/warsh20260828a.htm
4. Board of Governors of the Federal Reserve System. FOMC Statement and Implementation Note. July 29, 2026. https://www.federalreserve.gov/newsevents/pressreleases/monetary20260729a.htm
5. Board of Governors of the Federal Reserve System. Minutes of the Federal Open Market Committee, July 28–29, 2026. Released August 19, 2026. https://www.federalreserve.gov/monetarypolicy/fomcminutes20260729.htm
6. Bureau of Economic Analysis. Personal Income and Outlays, July 2026. Released August 26, 2026. https://www.bea.gov/news/2026/personal-income-and-outlays-july-2026
7. U.S. Bureau of Labor Statistics. Consumer Price Index — July 2026. Released August 12, 2026. https://www.bls.gov/news.release/cpi.nr0.htm
8. U.S. Bureau of Labor Statistics. The Employment Situation — July 2026. Released August 7, 2026. https://www.bls.gov/news.release/empsit.nr0.htm
9. U.S. Bureau of Labor Statistics. Schedule of Selected Releases, September 2026. https://www.bls.gov/schedule/2026/09_sched_list.htm
10. Board of Governors of the Federal Reserve System. FOMC Meeting Calendar, 2026. https://www.federalreserve.gov/monetarypolicy/fomccalendars.htm
11. National Association of Realtors. Existing-Home Sales Report Shows 1.7% Decrease in July. Released August 11, 2026. https://www.nar.realtor/newsroom/nar-existing-home-sales-report-shows-1-7-decrease-in-july
12. U.S. Census Bureau and U.S. Dept. of Housing and Urban Development. Monthly New Residential Sales, July 2026. Released August 25, 2026. https://www.census.gov/construction/nrs/pdf/newressales_202607.pdf
13. CNBC. September Fed Decision Is Now a Coin Flip as Rate Hike Odds Increase Post-Warsh. August 28, 2026. https://www.cnbc.com/2026/08/28/-september-fed-decision-now-a-coin-flip-as-rate-hike-odds-increase.html
14. CoinDesk. September Fed Rate Hike Fears Appear Overblown as the Probability Is Just 58%, Not 90%. August 31, 2026. https://www.coindesk.com/markets/2026/08/31/september-fed-rate-hike-fears-appear-overblown-as-the-probability-is-just-58-not-90
15. Advisor Perspectives. Treasury Yields Snapshot: August 28, 2026. https://www.advisorperspectives.com/dshort/updates/2026/08/28/treasury-yields-snapshot-august-28-2026
About the figures. All four figures were built from the published data cited above and are original to this issue. They are free for you to reproduce in your own newsletter, website or social posts. They contain no AI-generated imagery — every chart and table is computed from primary-source data. If you want to add a photograph, free-license options include Unsplash, Pexels and Pixabay, and photography produced by U.S. government agencies is generally in the public domain.
This email is for informational and educational purposes only and is not a commitment to lend. Rates quoted are national averages published by Freddie Mac and other sources named above; they are not an offer, quote or rate lock, and your own rate will depend on your credit profile, loan amount, property, occupancy, down payment, loan program and market conditions at the time of application. All loans are subject to credit approval, income verification and property appraisal. Payment examples show principal and interest only and exclude property taxes, homeowners insurance, mortgage insurance and HOA dues; your actual payment will be higher. Programs, rates and terms are subject to change without notice.