
Friday, August 21, 2026 at 9:29 AM PDT
Rates Slipped Again This Week — But Not for the Reason You'd Hope
The 30-year fixed fell for a second week in a row, to 6.65%. Behind that small, welcome number is a real argument inside the Federal Reserve about whether the next move should be a cut or a hike. How that argument resolves over the next three weeks matters far more to your payment than this week's two-hundredths of a point.
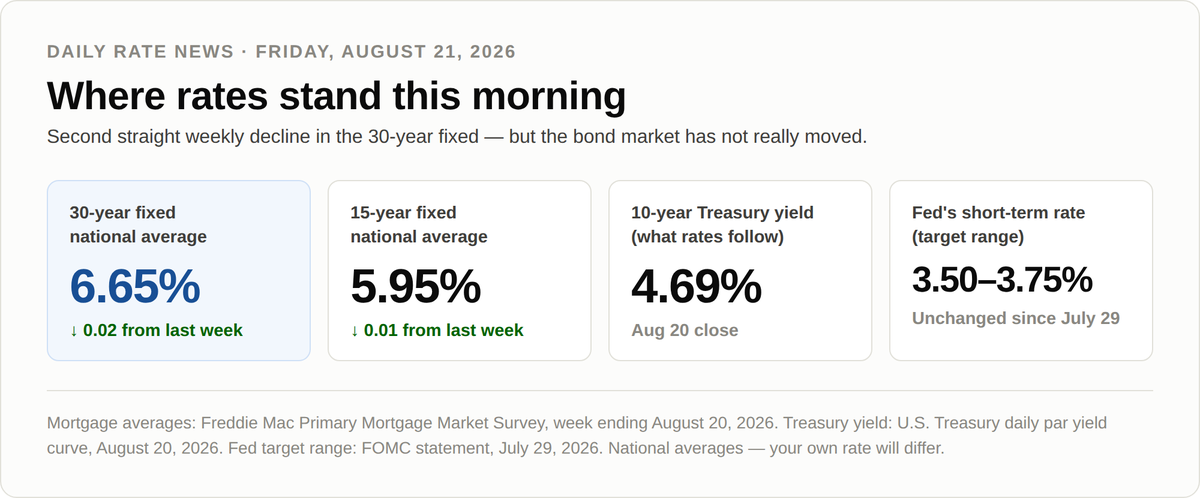
Figure 1. Rate snapshot. Sources: Freddie Mac Primary Mortgage Market Survey, week ending August 20, 2026; U.S. Department of the Treasury Daily Treasury Par Yield Curve, August 20, 2026; Federal Open Market Committee statement, July 29, 2026.
Start with the number
Freddie Mac's weekly survey put the 30-year fixed-rate mortgage at 6.65% for the week ending August 20, down from 6.67% the week before. The 15-year fixed averaged 5.95%, down a hair from 5.96%. Both are still higher than a year ago, when the same survey read 6.58% and 5.69%.
Two straight weekly declines sounds like momentum. It isn't, quite. The 30-year is down four one-hundredths of a point from its August 6 reading of 6.69% — about nine dollars a month on a typical loan. The direction is what's worth your attention, not the size.
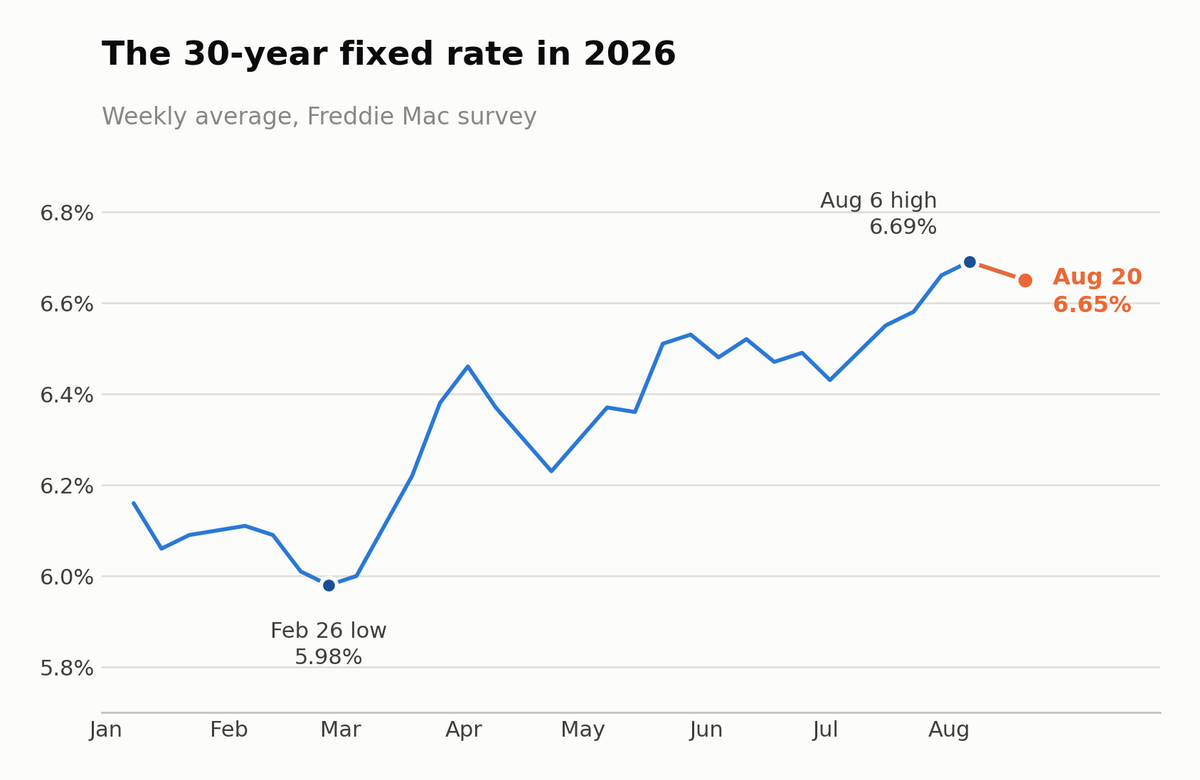
Figure 2. 30-year fixed-rate mortgage, weekly average, January 1 - August 20, 2026. Source: Freddie Mac Primary Mortgage Market Survey, released August 20, 2026.
Rates opened 2026 at 6.15% and slipped to 5.98% in late February, the lowest weekly average of the year. From there they climbed for most of the spring and summer, adding roughly seven-tenths of a percentage point by early August. This week's dip is a pause in that climb. Whether it becomes a turn depends on things that haven't happened yet.
Why rates aren't falling faster
Here's the piece most people get backward. Your mortgage rate does not follow the Fed's short-term rate. It follows the 10-year Treasury yield — the return investors demand for lending to the U.S. government for a decade. Mortgages are long-term loans too, so they're priced off that same long-term expectation. When the 10-year rises, mortgage rates follow within days, almost every time.
That yield closed at 4.69% on August 20. And it has barely budged all month: every single daily close in August landed between 4.63% and 4.72%.
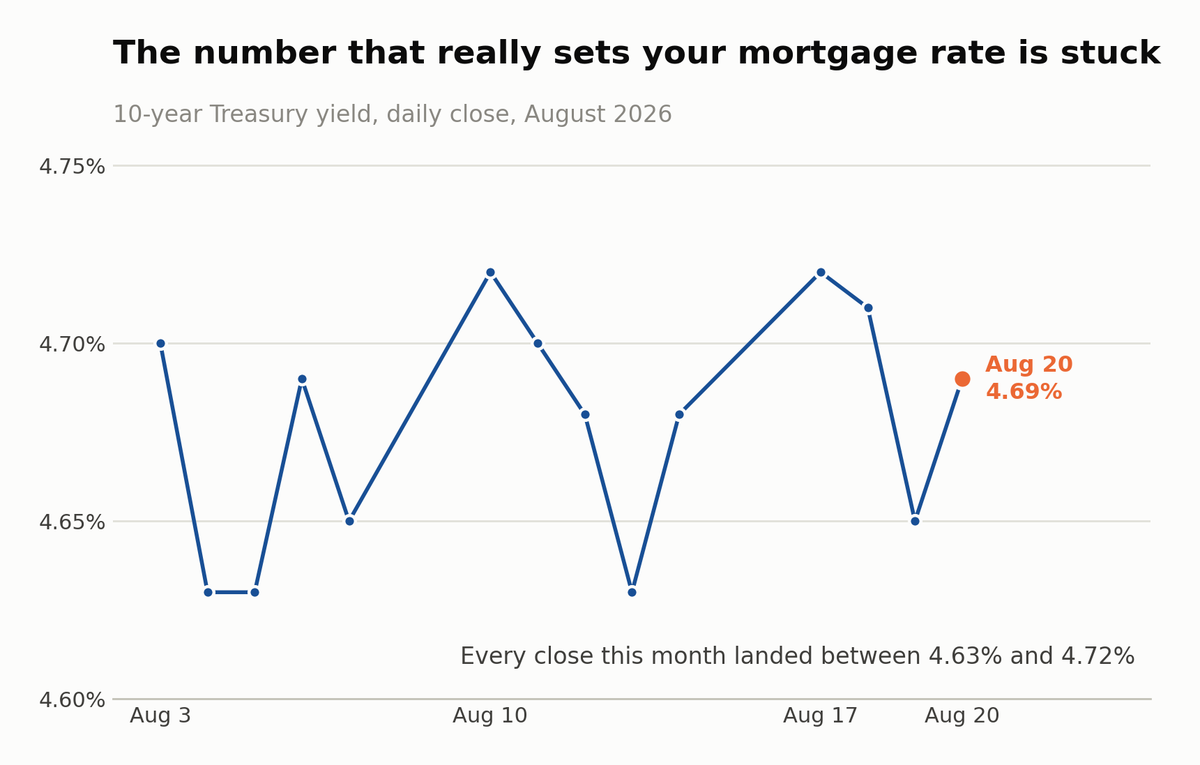
Figure 3. 10-year Treasury constant maturity yield, daily close, August 3 - 20, 2026. Source: U.S. Department of the Treasury, Daily Treasury Par Yield Curve Rates, August 2026.
The reason it's stuck is that two forces are pushing on it in opposite directions.
Pushing rates up: inflation — specifically, fuel. The Bureau of Labor Statistics reported that consumer prices rose 3.4% over the 12 months ending in July. Strip out food and energy and the "core" reading is a much calmer 2.5%. The gap between those two numbers is the whole story. Energy prices are up 14.7% over the year, and gasoline alone is up 24.6%. The Energy Information Administration had regular gasoline averaging $4.05 a gallon in the week ending August 17, against $3.13 a year earlier. Conflict in the Middle East has kept crude oil elevated, with Brent crude trading above $90 a barrel through August.
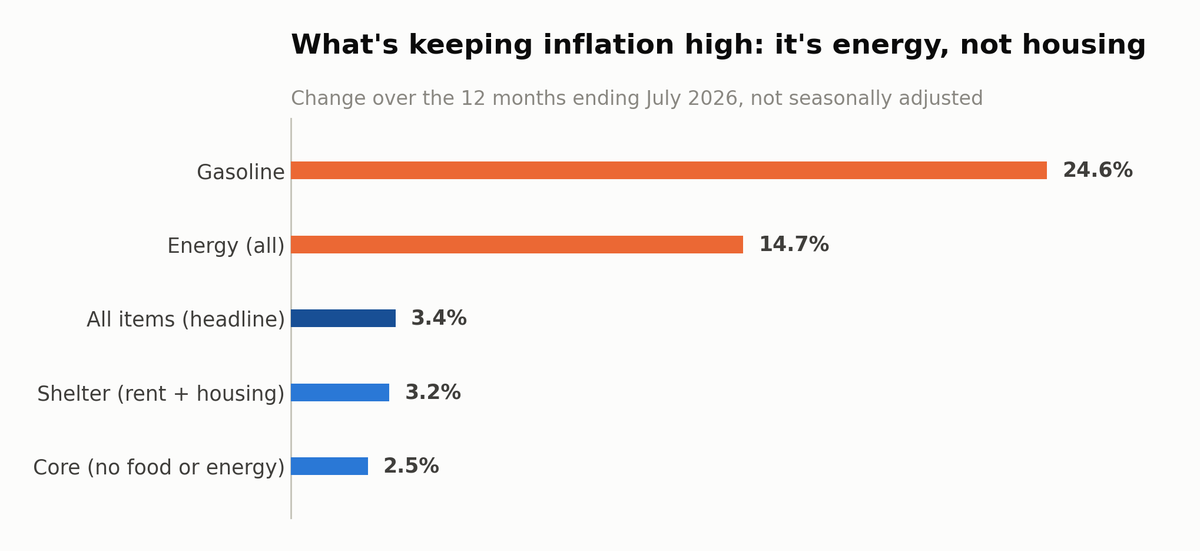
Figure 4. Consumer Price Index, 12-month percent change by category, July 2026, not seasonally adjusted. Source: U.S. Bureau of Labor Statistics, Consumer Price Index - July 2026, released August 12, 2026.
Notice what is not driving inflation anymore: shelter, the category that covers rent and housing costs, rose just 3.2% over the year, and only 0.1% in July.
Pushing rates down: a job market that is cooling off. The July employment report showed the economy lost 23,000 jobs. Unemployment held at 4.1%, but the revisions were the part that got the bond market's attention — May and June were revised down by a combined 103,000 jobs. Average hourly earnings rose 3.2% over the year, which is less than the 3.4% inflation rate. In plain terms, the average paycheck lost a little ground.
The Fed is genuinely split
On July 29 the Fed left its short-term rate alone at a target range of 3.50% to 3.75%. But the vote was 9 to 3, and here's the unusual part: the three dissenters wanted to raise rates, not cut them. Expensive fuel is an inflation problem, and raising rates is the Fed's tool for inflation. A weakening job market is the opposite problem, and raising rates would make it worse.
Markets have swung around on this. Fed funds futures tracked by the CME FedWatch tool put the odds of a September rate hike near 30%, with a hold at roughly 70%, as reported by Yahoo Finance on August 17 — down sharply from where they sat in late July, before that soft jobs report. Goldman Sachs chief economist Jan Hatzius has argued that market pricing is "too hawkish" and expects the Fed to hold its current range through the rest of 2026.
The practical takeaway for you: nobody credible is forecasting a big drop in mortgage rates this fall. The realistic range of outcomes runs from roughly where we are now to modestly higher.
What a quarter-point actually costs
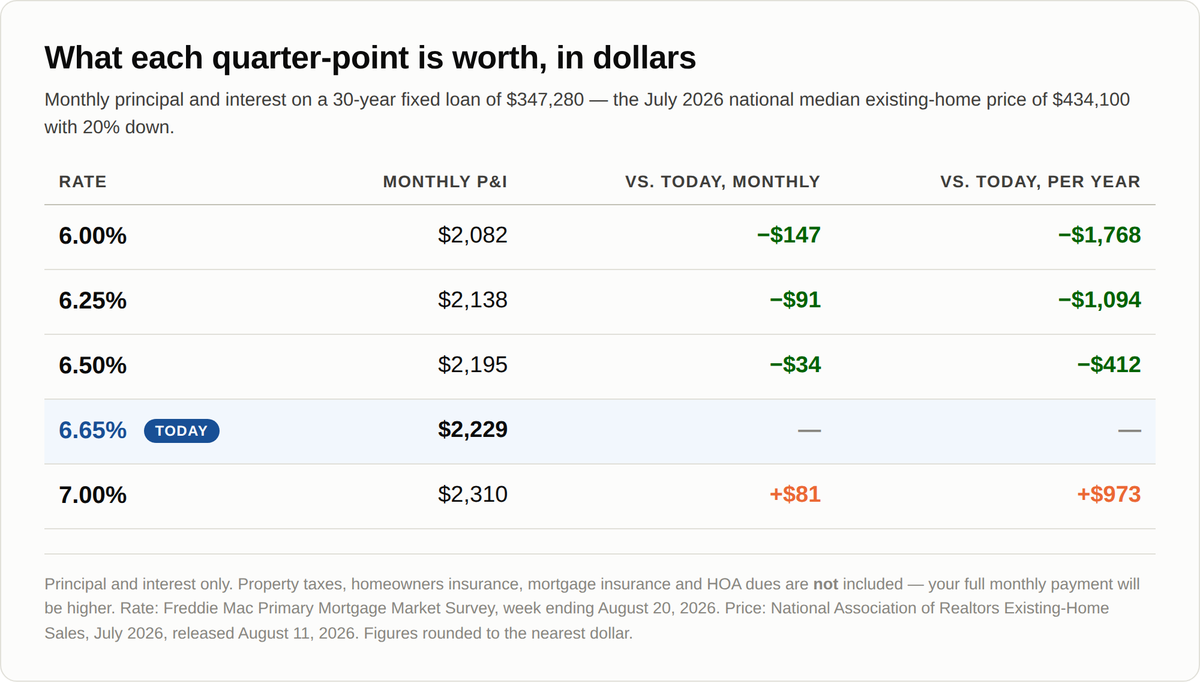
Figure 5. Monthly principal and interest by interest rate on a $347,280 loan (July 2026 national median existing-home price of $434,100, 20% down, 30-year term). Original calculation. Rate source: Freddie Mac PMMS, week ending August 20, 2026. Price source: National Association of Realtors, Existing-Home Sales, July 2026, released August 11, 2026. Taxes, insurance, mortgage insurance and HOA dues excluded.
The distance between 6.50% and 7.00% — half a point, the kind of move that can happen in six weeks — is about $115 a month, or roughly $1,385 a year, on a median-priced home.
It also shows why chasing a rate can backfire. Waiting for 6.00% would save $147 a month. But the July median price rose 2.0% over the year, and 2.0% of $434,100 is about $8,700. Wait a year for a rate that may not arrive, and a price increase can eat the savings before you reach the closing table.
The housing market, briefly
Existing-home sales ran at an annual pace of 4.06 million in July, down 1.7% from June but up 0.7% from a year ago, according to the National Association of Realtors. The national median price was $434,100, up 2.0% over the year. There were 1.54 million homes for sale — a 4.6-month supply, which is close to what economists consider a balanced market and much healthier than the near-empty shelves of a few years ago. Homes took an average of 29 days to sell. First-time buyers made up 29% of purchases.
NAR chief economist Lawrence Yun put it this way: "Home sales have been remarkably stable, even amid the rising mortgage rate environment of the past few months... there's no doubt that the housing market would be thriving if average mortgage rates were to return near 6%."
What to watch over the next three weeks
August 27–29 — the Fed's Jackson Hole symposium. Central bankers gather in Wyoming every August, and what they say there often moves bond markets.
Thursday, August 27 — the next Freddie Mac survey. Tells us whether this dip has a third week in it.
Mid-September — August inflation and jobs data, then the Fed's decision on September 15–16, which also brings updated forecasts from Fed officials.
What I'd do
If you're under contract or shopping seriously: lock. The upside is a few hundredths of a point; the downside is Jackson Hole or a hot September inflation reading moving rates a quarter-point the wrong way. Ask me about a float-down, which lets you lock now and still capture a real drop if one shows up.
If you're sitting at 7.5% or higher: run the refinance math with me now. The break-even is simpler than people expect — closing costs divided by monthly savings gives you the months it takes to come out ahead.
If you're waiting for 5.99% to buy: talk to me first. That plan works only if prices stay flat too, and right now they aren't.
Happy to run your actual numbers — not national averages — any time. Reply to this email or give me a call.
Want your real numbers, not the national average?
I'll run a rate quote and a payment breakdown for your price range - no credit pull required to start.
References
Freddie Mac. Primary Mortgage Market Survey - Mortgage Rates Decline for Second Consecutive Week. August 20, 2026. https://www.freddiemac.com/pmms
U.S. Bureau of Labor Statistics. Consumer Price Index - July 2026. August 12, 2026. https://www.bls.gov/news.release/cpi.nr0.htm
U.S. Bureau of Labor Statistics. The Employment Situation - July 2026. August 7, 2026. https://www.bls.gov/news.release/empsit.nr0.htm
Board of Governors of the Federal Reserve System. Federal Reserve issues FOMC statement. July 29, 2026. https://www.federalreserve.gov/newsevents/pressreleases/monetary20260729a.htm
Board of Governors of the Federal Reserve System. FOMC Meeting Calendars. accessed August 21, 2026. https://www.federalreserve.gov/monetarypolicy/fomccalendars.htm
U.S. Department of the Treasury. Daily Treasury Par Yield Curve Rates, August 2026. August 20, 2026. https://home.treasury.gov/resource-center/data-chart-center/interest-rates/TextView?type=daily_treasury_yield_curve&field_tdr_date_value=2026
National Association of Realtors. Existing-Home Sales Report Shows 1.7% Decrease in July. August 11, 2026. https://www.nar.realtor/newsroom/nar-existing-home-sales-report-shows-1-7-decrease-in-july
U.S. Energy Information Administration. Gasoline and Diesel Fuel Update. week ending August 17, 2026. https://www.eia.gov/petroleum/gasdiesel/
Yahoo Finance. Odds of Fed Rate Hike This Year Fall as Goldman Sachs Warns Against Hawkish Bets (CME FedWatch data). August 17, 2026. https://finance.yahoo.com/economy/policy/articles/odds-fed-rate-hike-fall-083935313.html
Federal Reserve Bank of Kansas City. Jackson Hole Economic Policy Symposium. August 27-29, 2026. https://www.kansascityfed.org/research/jackson-hole-economic-symposium/
All figures in this issue are original charts and tables produced for Daily Rate News from published government and industry data. They are free for you to reproduce and redistribute under your own branding. No AI-generated imagery is used anywhere in this issue. If you want to add a photograph, free-license options include Unsplash, Pexels and Pixabay; U.S. government photography (for example from the Federal Reserve or the Census Bureau) is generally in the public domain.