
Tuesday, October 20, 2026 at 7:22 AM PDT
Oil Just Hit a Five-Month High. That’s Why Your Rate Isn’t Falling.
Crude oil jumped again Tuesday morning, and energy costs are the single biggest reason the 30-year fixed is sitting at 7.40% instead of in the sixes. Meanwhile, new government figures showed home building pulling back again. Here’s what happened, what it costs in real dollars, and what I’d do about it this week.
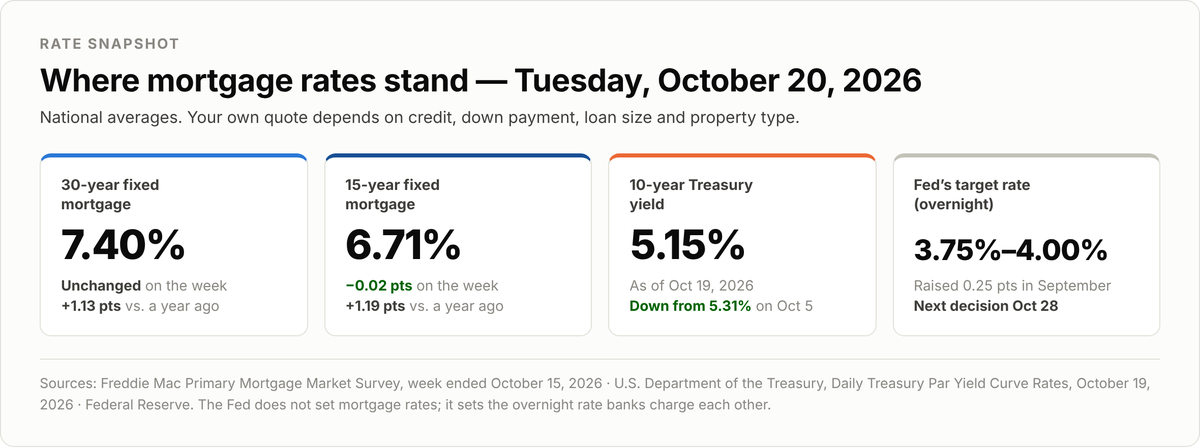
Figure 1. Rate snapshot. Sources: Freddie Mac, Primary Mortgage Market Survey, week ended October 15, 2026; U.S. Department of the Treasury, Daily Treasury Par Yield Curve Rates, October 19, 2026; Federal Reserve, FOMC statement of September 16, 2026.
What moved today
Two things, and they point in opposite directions.
Oil spiked. Brent crude, the global benchmark, rose about 1.5% to roughly $111 a barrel on Tuesday — a five-month high — after attacks on Saudi energy and airport facilities. U.S. crude climbed past $100. Analysts quoted by The National said surging energy costs make another Federal Reserve rate increase next week more likely, not less.
Home building fell. The Census Bureau reported Tuesday morning that builders broke ground on new homes at an annual pace of 1,221,000 in September — down 5.2% from August and 7.4% from a year ago. Single-family starts fell 4.6%, to 859,000. Permits, which signal what’s coming next, were flat at 1,400,000.
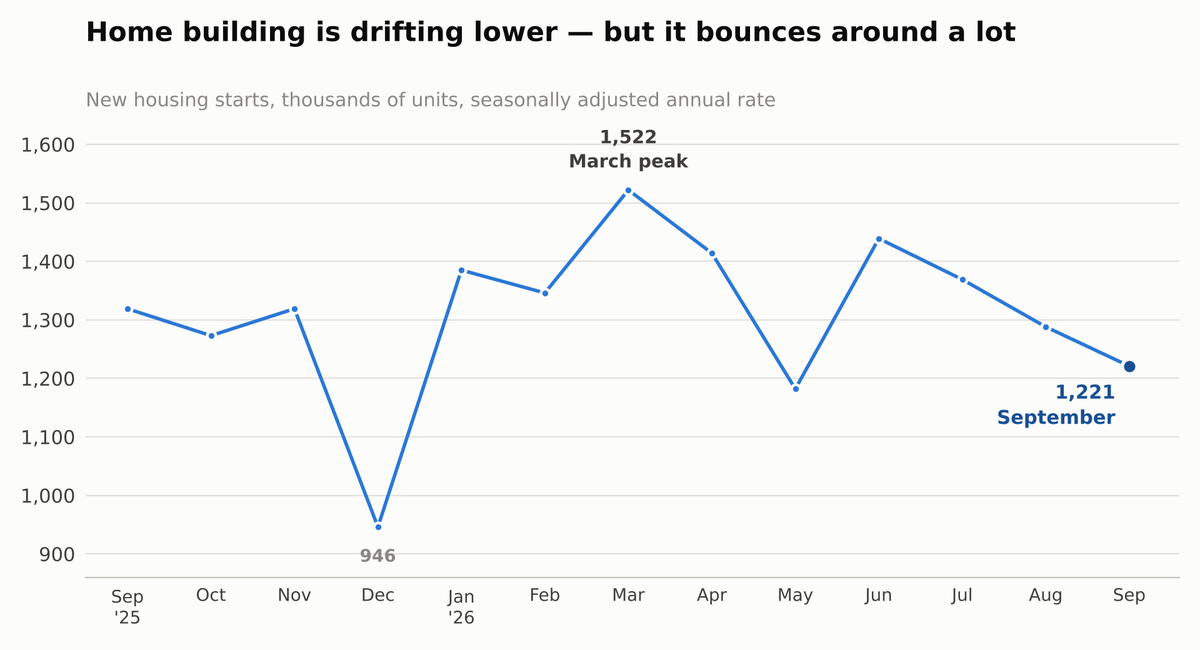
Figure 2. Total new housing starts, seasonally adjusted annual rate. Source: U.S. Census Bureau and U.S. Department of Housing and Urban Development, Monthly New Residential Construction, September 2026, released October 20, 2026. July and August figures are revised; September is preliminary.
One fair warning: Census itself says that monthly change isn’t statistically significant — the margin of error is wide enough that part of the drop could be noise. The direction is what matters, and it’s been down since spring.
Why oil shows up in your mortgage payment
Mortgage rates don’t follow the Fed’s rate. They follow the 10-year Treasury yield — what investors earn for lending money to the U.S. government for a decade. When investors expect higher inflation, they demand a higher yield to protect themselves, and mortgage rates follow it up.
Right now, inflation is an energy story. September’s numbers from the Bureau of Labor Statistics, released October 14: consumer prices rose 0.6% in a single month and 3.7% over the year. Take out food and energy, and that “core” rate was just 2.6%. The gap is fuel — the gasoline index was up 34.2% from a year earlier. AAA had the national average near $4.30 a gallon Monday, against roughly $3.04 a year ago.
Wholesale prices said the same. Producer prices jumped 1.3% in September, and the government noted that more than 80% of the rise in goods prices came from energy.
So when oil spikes, investors expect more inflation, Treasury yields resist falling, and your rate stays put. Until energy costs settle down, mortgage rates are unlikely to fall much.
The Fed has already reacted. At its September 16 meeting it raised its short-term rate by a quarter point, to a range of 3.75%–4.00%. It meets again on October 28.
Where rates actually are
Freddie Mac’s weekly survey put the 30-year fixed at 7.40% for the week ending October 15 — unchanged from the week before, and the first week since late August it didn’t rise. The 15-year fixed slipped slightly, to 6.71%.
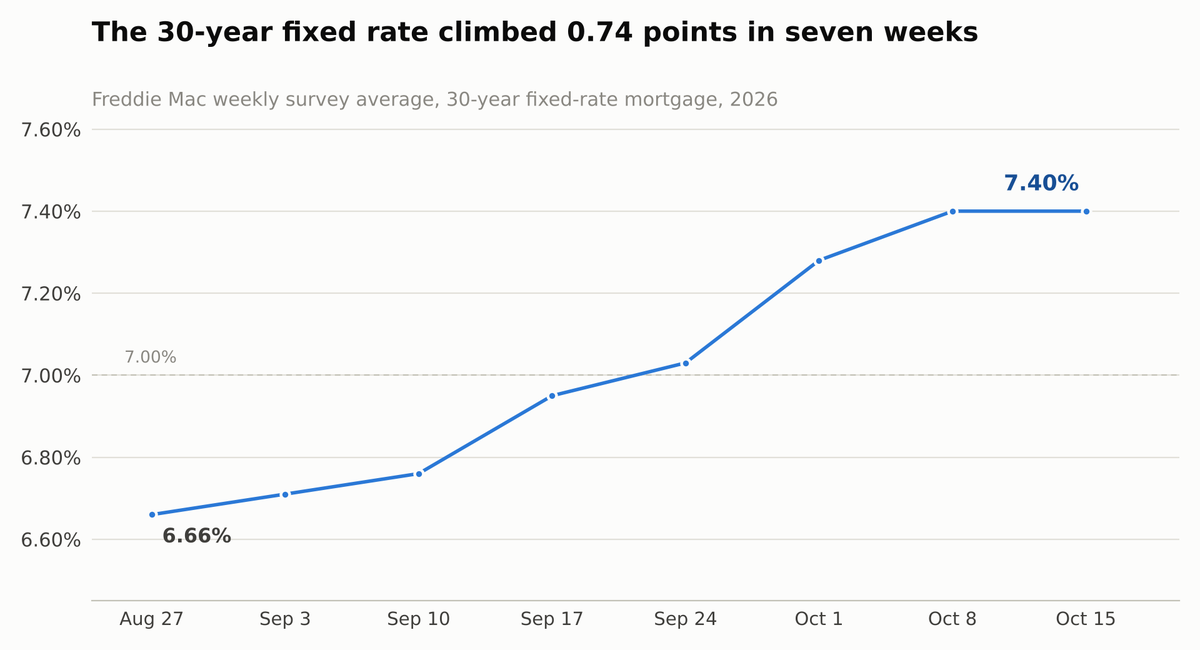
Figure 3. Weekly average 30-year fixed mortgage rate. Source: Freddie Mac, Primary Mortgage Market Survey, weeks ended August 27 through October 15, 2026 (latest release October 15, 2026).
Steady is not the same as affordable. Seven weeks earlier, that same survey read 6.66%. A year ago it was 6.27%.
There is one encouraging number here. The 10-year Treasury yield — the thing mortgage rates actually track — closed at 5.15% Monday, down from 5.31% on October 5, and touched 5.09% on October 16. Mortgage rates lag that yield by a week or two, so if the 10-year holds near 5.10%, the survey rate has room to drift down even without new good news.
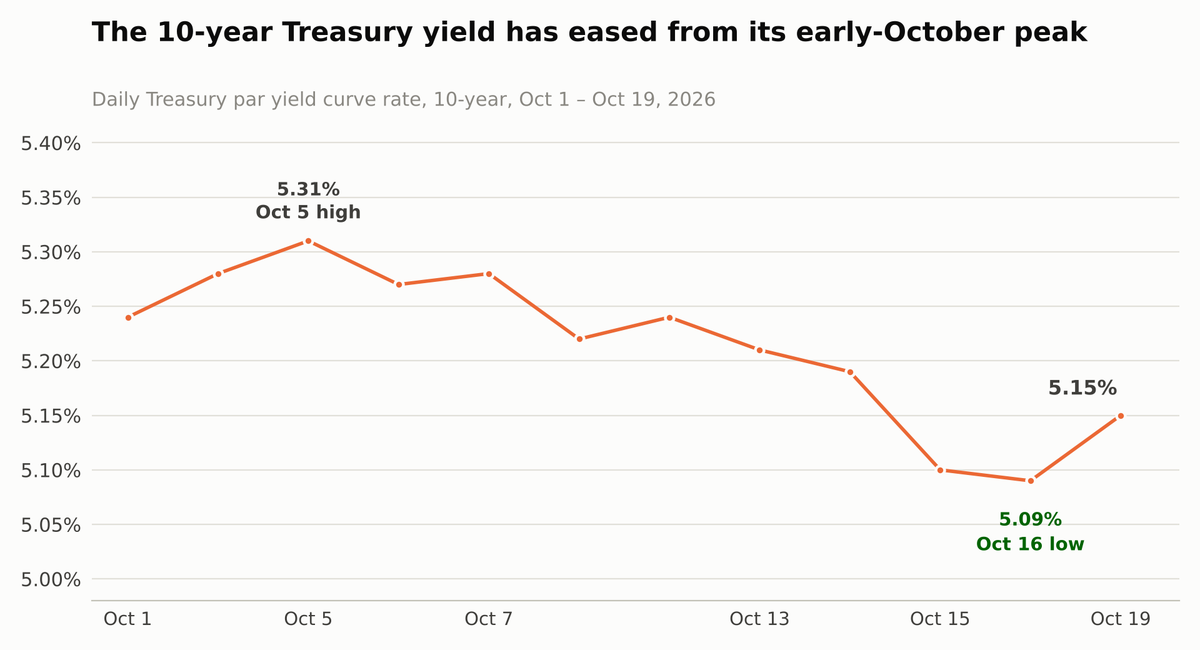
Figure 4. 10-year Treasury constant maturity yield, daily. Source: U.S. Department of the Treasury, Daily Treasury Par Yield Curve Rates, October 1 through October 19, 2026. No quote for October 12 (Columbus Day).
What it costs, in dollars
The national median existing-home price was $417,500 in September, according to the National Association of Realtors. With 20% down, that’s a $334,000 loan.
At today’s 7.40%, principal and interest run $2,313 a month. At 7.00%, it’s $2,222 — $90 a month less, or about $1,085 a year. Get back to 6.50% and you’re at $2,111, saving $201 a month or $2,417 a year. At 6.00%, $2,003 — $310 a month, $3,721 a year.
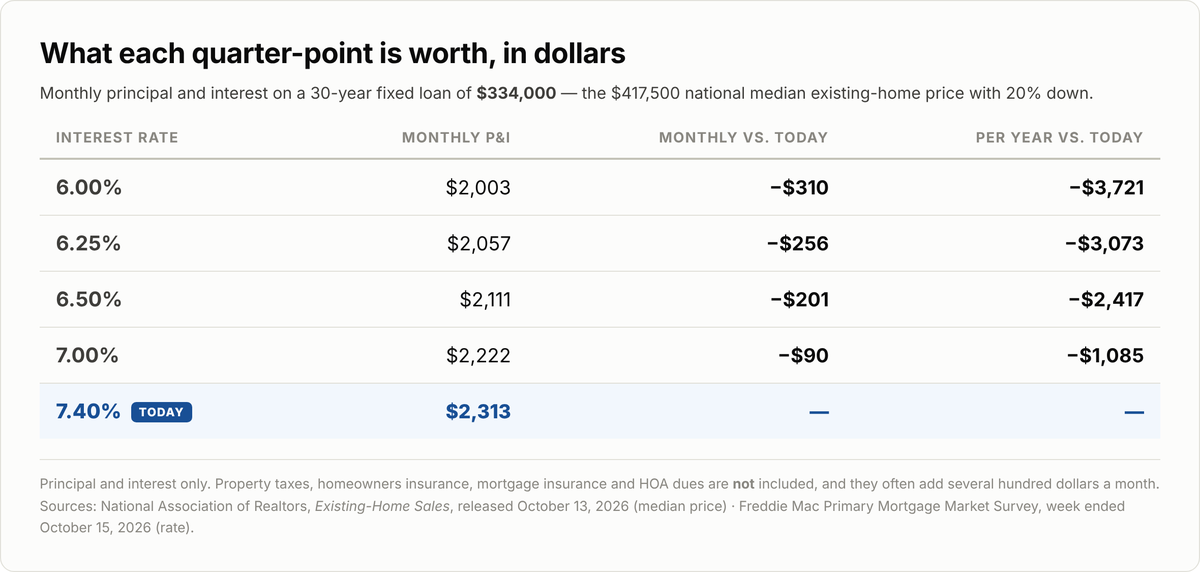
Figure 5. Monthly principal and interest by rate. Sources: National Association of Realtors, Existing-Home Sales, released October 13, 2026 (median price); Freddie Mac, Primary Mortgage Market Survey, week ended October 15, 2026 (current rate). Payments calculated by Daily Rate News on a $334,000 30-year fixed loan. Taxes, insurance, mortgage insurance and HOA dues are excluded.
That’s the arithmetic behind every conversation about waiting. A half-point is real money — and also not life-changing money on a median-priced home, worth remembering if you’re on the fence about a house you actually want.
The housing market right now
Builders are hurting, and they’re saying so. The National Association of Home Builders’ confidence index fell three points to 29 in October — its lowest reading since June 2012. Below 50 means more builders rate conditions poor than good. Buyer foot traffic dropped to 18.
Here’s the part that’s useful to you: 43% of builders cut prices this month, the largest share in the 2020–2026 period NAHB reports, with the average cut at 6%. And 65% are offering incentives — frequently paying to buy your interest rate down. If you’re shopping, new construction is where the negotiating leverage is right now.
Resale is slower but not frozen. Existing-home sales rose 1.5% in September to an annual pace of 3.99 million, still down 2.2% from a year ago. Inventory climbed to 1.60 million homes, a 4.8-month supply, and homes sat a median of 33 days. First-time buyers were 31% of sales.
NAR’s chief economist, Lawrence Yun, put it plainly: “Further increases in mortgage rates in recent weeks mean fewer buyers can qualify to purchase a home.”
What to watch this week
Thursday: weekly jobless claims (8:30 a.m. ET) and the Conference Board’s Leading Economic Index (10 a.m.).
Friday: S&P Global’s first October reads on manufacturing and services (9:45 a.m.), plus the University of Michigan’s final consumer sentiment reading (10 a.m.). The preliminary reading was 46.3, with year-ahead inflation expectations at 4.7% — consumers are feeling the fuel prices.
No Fed speeches. Officials are in their quiet period from October 17 through October 29, so nobody will be hinting at anything before the October 28 decision.
As of Monday morning, futures-market odds derived from the CME FedWatch tool put the chance of a hike at next week’s meeting at roughly 15%, with about 90% odds of at least one more increase by December, according to Charles Schwab’s market commentary. Those odds were measured before Tuesday’s oil move, so treat them as a floor, not a forecast.
What I’d do
If you’re under contract: lock. Between now and October 28 the downside risk is bigger than the upside. A Fed that sounds worried about energy could push rates up fast; a friendly Fed saves you a few basis points you could refinance into later anyway.
If you’re shopping: focus on new construction and on sellers who’ve had a home sitting. With 43% of builders cutting prices and inventory at a 4.8-month supply, a permanent rate buydown paid by a builder or seller is worth more than waiting for the market to hand you one.
If you’re thinking about refinancing: at 7.40%, almost nobody should be — unless you’re carrying high-rate credit card or auto debt and have real equity. Then the math can work even today. Call me and we’ll run it.
If you’re waiting for the sixes: that’s a reasonable thing to want, but it likely needs energy prices to come down first. Watch oil, not the Fed.
Want your own numbers instead of the national averages?
A real quote takes about ten minutes and there’s no cost to find out where you stand.
REFERENCES
1. Freddie Mac. Primary Mortgage Market Survey — “Mortgage Rates Hold Steady at 7.40%.” Released October 15, 2026. https://www.freddiemac.com/pmms
2. U.S. Census Bureau and U.S. Department of Housing and Urban Development. Monthly New Residential Construction, September 2026. Released October 20, 2026. https://www.census.gov/construction/nrc/pdf/newresconst.pdf
3. U.S. Bureau of Labor Statistics. Consumer Price Index — September 2026. Released October 14, 2026. https://www.bls.gov/news.release/cpi.nr0.htm
4. U.S. Bureau of Labor Statistics. Producer Price Indexes — September 2026. Released October 15, 2026. https://www.bls.gov/news.release/ppi.nr0.htm
5. U.S. Department of the Treasury. Daily Treasury Par Yield Curve Rates. Data through October 19, 2026. https://home.treasury.gov/resource-center/data-chart-center/interest-rates/TextView?type=daily_treasury_yield_curve&field_tdr_date_value=2026
6. Board of Governors of the Federal Reserve System. Federal Open Market Committee statement. Released September 16, 2026. https://www.federalreserve.gov/newsevents/pressreleases/monetary20260916a.htm
7. National Association of Realtors. Existing-Home Sales Increased 1.5% in September.Released October 13, 2026. https://www.nar.realtor/newsroom/existing-home-sales-increased-1-5-in-september-according-to-nar-report
8. National Association of Home Builders / Wells Fargo. Housing Market Index — “Builder Sentiment Falls on Rising Rates.” Released October 19, 2026. https://www.nahb.org/news-and-economics/press-releases/2026/10/builder-sentiment-falls-on-rising-rates
9. University of Michigan. Surveys of Consumers — preliminary October 2026. Released October 9, 2026. http://www.sca.isr.umich.edu/
10. AAA. National Average Gas Prices. Retrieved October 20, 2026. https://gasprices.aaa.com/
11. The National. “Oil prices hit five-month high as Houthi escalation worsens supply and inflation fears.” Published October 20, 2026. https://www.thenationalnews.com/business/energy/2026/10/20/oil-prices-hit-five-month-high-as-more-houthi-attacks-prompt-supply-and-inflation-fears/
12. Charles Schwab. Market Open Update (CME FedWatch-derived probabilities). Published October 19, 2026. https://www.schwab.com/learn/story/stock-market-update-open
13. Federal Reserve Bank of St. Louis. FOMC Blackout Periods, 2026. https://www.stlouisfed.org/about-us/resources/blackout-periods
About these figures. All five figures were built by Daily Rate News from the published source data cited in each caption. They are original work and free for you to reproduce and re-send under your own name. No AI-generated imagery is used anywhere in this issue — every figure is a chart or table computed directly from the published numbers. If you add a lead photo, free-license options include Unsplash, Pexels and Pixabay; U.S. federal government photography is in the public domain.
One note on precision. The crude oil prices and the CME FedWatch-derived odds above are market quotes that move during the trading day; they are accurate as of Tuesday morning, October 20, 2026. Every government statistic cited is a published figure from the release named in its caption.