
Wednesday, October 21, 2026 at 5:52 AM PDT
Mortgage Rates Just Fell for the First Time in Two Months
After seven straight weeks of climbing, the average 30-year rate finally ticked down this morning. The relief is real but small — and the bigger decision lands next Wednesday, when the Federal Reserve meets.
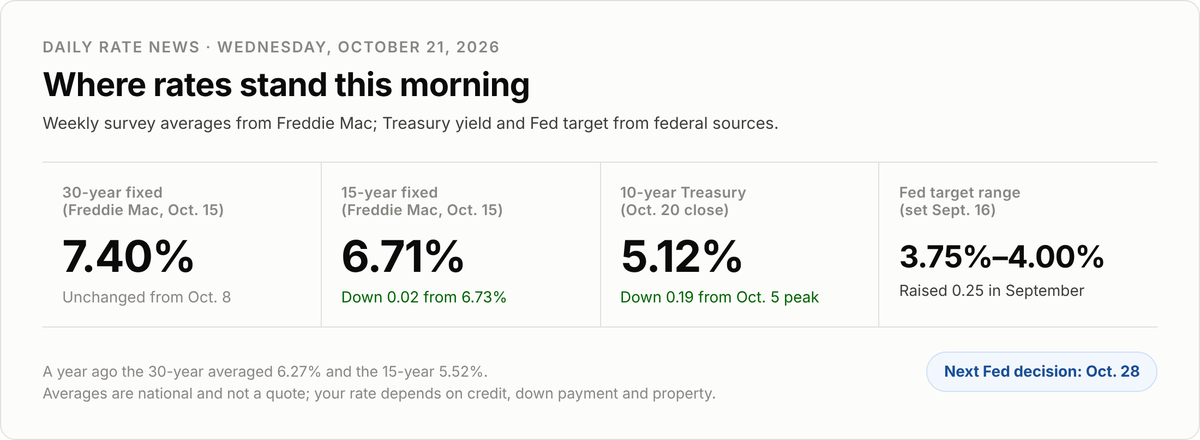
Figure 1. Rate snapshot. Sources: Freddie Mac Primary Mortgage Market Survey, released Oct. 15, 2026; U.S. Department of the Treasury daily par yield curve, Oct. 20, 2026; Federal Reserve FOMC statement, Sept. 16, 2026.
What happened this morning
The Mortgage Bankers Association released its weekly applications survey today. For the week ending October 16, the average contract rate on a 30-year fixed mortgage was 7.41% — down from 7.50% the week before.
That sounds like a rounding error, and in dollar terms it nearly is. But it breaks a streak. It is the first weekly decline in about two months, after a run that pushed the Freddie Mac survey average up seven weeks in a row to 7.40% on October 8 — the highest reading since November 16, 2023, when it hit 7.44%, according to the Associated Press.
Last week's Freddie Mac survey held at 7.40% for the 30-year and slipped to 6.71% for the 15-year. A year ago those averages were 6.27% and 5.52%.
The odd part of today's report: cheaper money did not bring anyone back. Total applications fell 5.3%. Purchase applications dropped 7% and sit about 18% below a year ago; refinances fell 2% and are down roughly 59%. MBA economist Joel Kan put it plainly — “lower rates just aren't enough to get buyers or refinancers moving right now.”
Why rates eased
Mortgage rates follow the 10-year Treasury yield more closely than they follow anything the Fed does directly. That yield peaked at 5.31% on October 5, drifted down through the middle of the month, and closed Monday at 5.12%, per Treasury Department data.
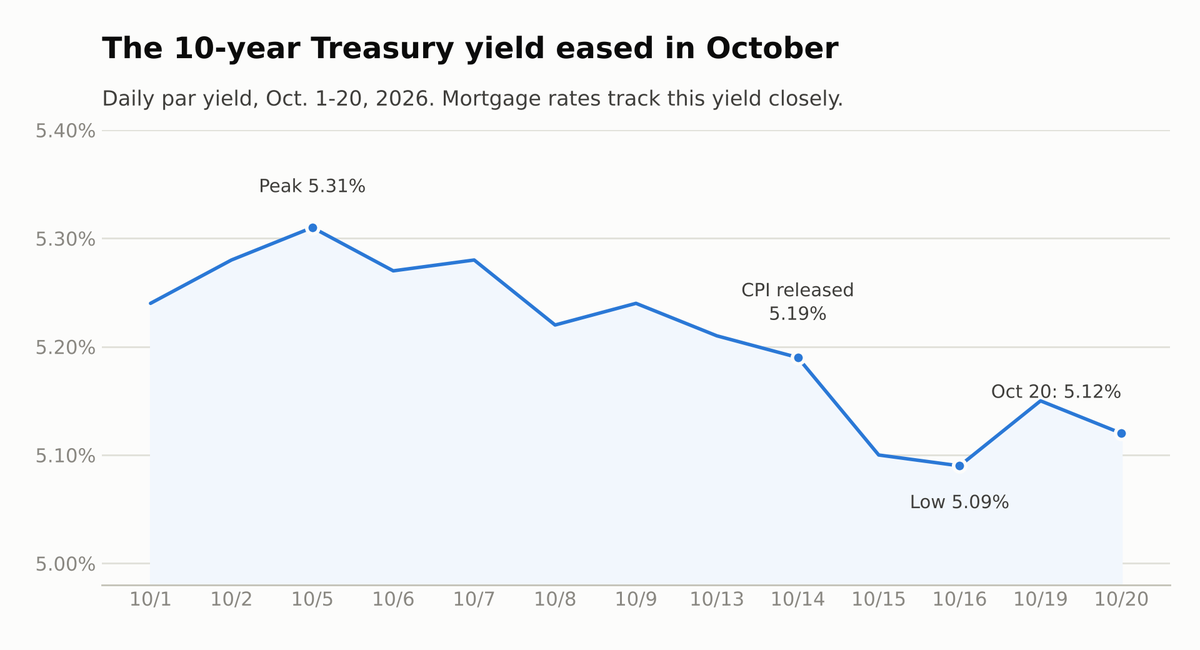
Figure 2. 10-year Treasury par yield, daily, Oct. 1–20, 2026. Source: U.S. Department of the Treasury, Daily Treasury Par Yield Curve Rates.
What's strange is that the yield fell after two hot inflation reports, not before them.
The Bureau of Labor Statistics reported on October 14 that consumer prices rose 0.6% in September and 3.7% over the past twelve months — a touch above the 3.6% economists had penciled in. The next day, the BLS said wholesale prices were up 6.3% over twelve months, the largest such increase since December 2022.
So why didn't yields spike? Because of what sat underneath the headline. Core inflation — the measure that strips out food and energy, which bounce around for reasons that have little to do with the broader economy — rose just 0.3% in September and 2.6% over the year. Bond traders read the gap between 3.7% and 2.6% as an energy problem rather than an everything problem, and energy problems tend to fade on their own.
Then, on October 16, Fed Chair Kevin Warsh spoke in Bangkok and declined to tip his hand. He noted the Fed had “removed a dose of accommodation about a month ago” — a reference to September's quarter-point hike, which took the target range to 3.75%–4.00% on a unanimous 12–0 vote, the first increase since 2023 — and added simply, “I don't prejudge meetings.”
Markets took the non-answer as a signal to relax. CME FedWatch-derived odds of a hike at next week's meeting fell to around 15% by that Friday, according to FXStreet; Forbes, citing the same tool early this week, put the chance of no move at roughly eight in ten. The expectation has largely shifted to December.
What it costs in dollars
Here is the part that matters at the closing table. First, how the survey average got here.
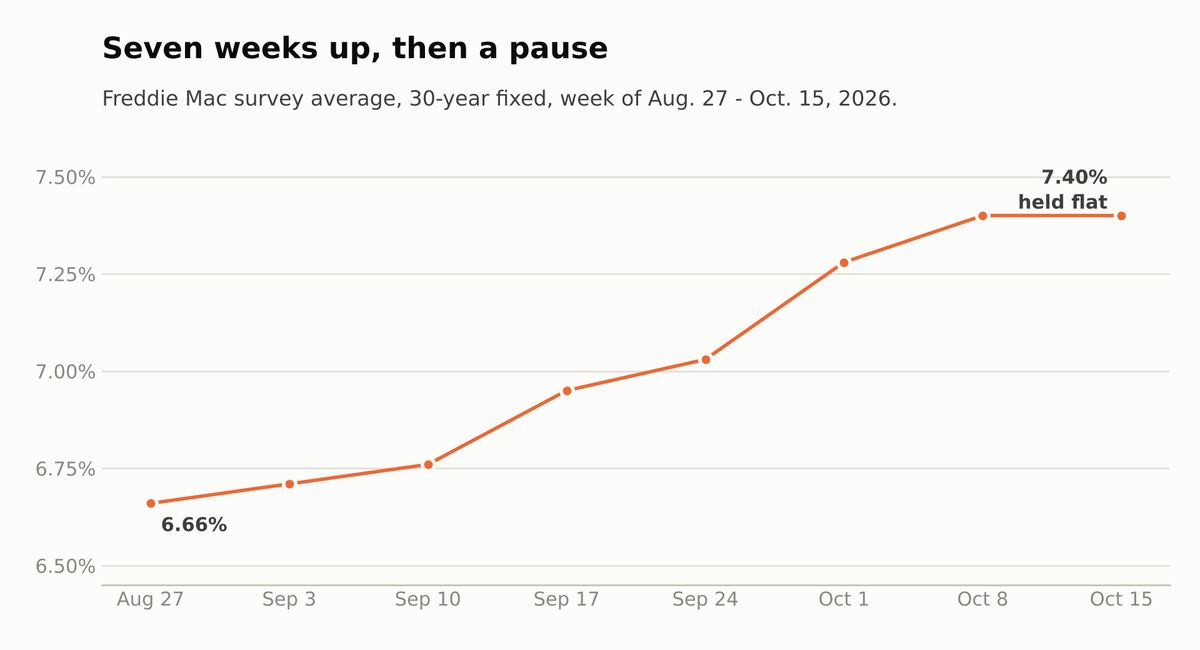
Figure 3. Freddie Mac 30-year fixed-rate mortgage survey average, weekly, week of Aug. 27 through Oct. 15, 2026. Source: Freddie Mac Primary Mortgage Market Survey.
And this is what each rate costs on a real loan. The National Association of Realtors put the median existing-home price at $417,500 in September. Put 20% down and you're borrowing $334,000.
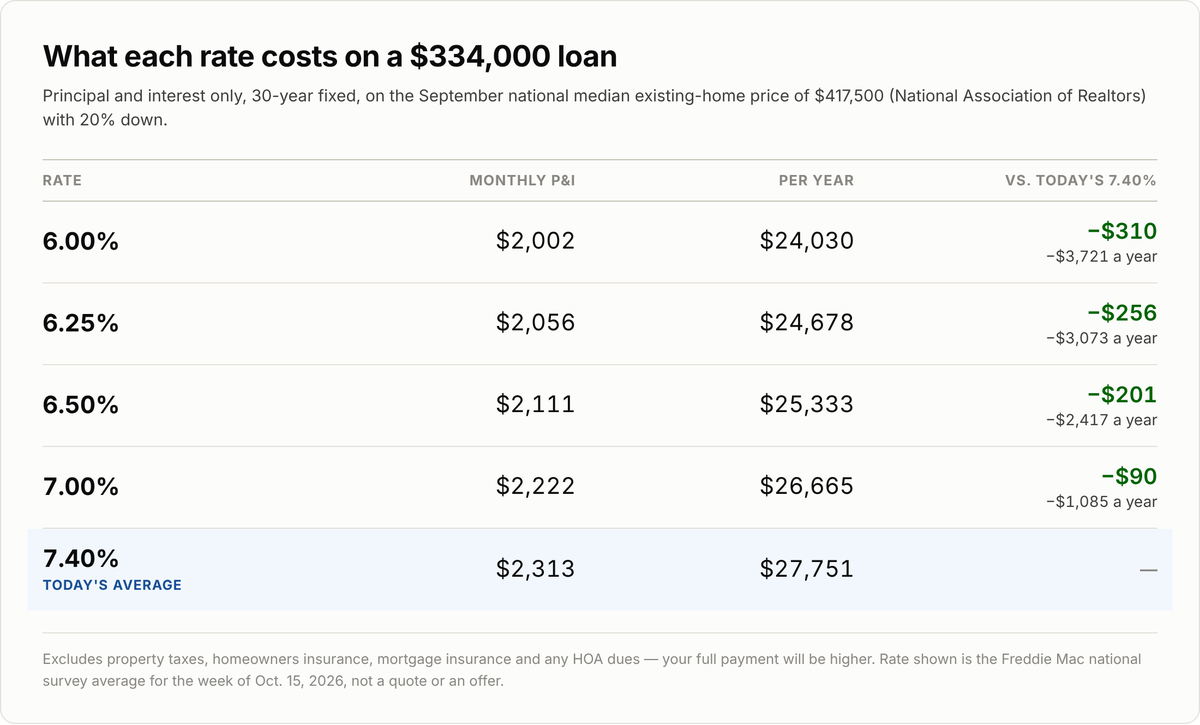
Figure 4. Monthly principal and interest on a $334,000 30-year fixed loan. Price source: National Association of Realtors, Existing-Home Sales, released Oct. 13, 2026. Rate source: Freddie Mac PMMS, week of Oct. 15, 2026. Payments calculated by Daily Rate News.
The spread between 6.00% and today's 7.40% is $310 a month, or $3,721 a year, on the same house. That gap — not the home price — is what has changed most about affordability this year.
Taxes, homeowners insurance, mortgage insurance and any HOA dues sit on top of those numbers, so your real payment will be meaningfully higher.
The housing market right now
Existing-home sales ran at a 3.99 million annual pace in September, up 1.5% from August but down 2.2% from a year ago, NAR reported on October 13. NAR Chief Economist Lawrence Yun noted that “August and September marked the two slowest months for home sales this year,” and that “further increases in mortgage rates in recent weeks mean fewer buyers can qualify to purchase a home.”
The median price was up 1.3% from last September — close to flat once you account for inflation. Inventory climbed to 1.60 million homes, a 4.8-month supply, up 4.6% from a year ago.
Together those numbers describe a market with more to choose from and less competition than you've seen in years. Prices aren't falling much, but they aren't running away from you either.
What to watch this week
Thursday, 8:30 a.m. ET — weekly jobless claims. A soft labor market generally pushes yields and mortgage rates down; a strong one does the opposite.
Thursday, noon ET — the next Freddie Mac survey. This is where last week's lower Treasury yields should show up.
Friday, 10:00 a.m. ET — the University of Michigan's final October consumer sentiment reading, alongside S&P Global's flash PMIs at 9:45.
Next Wednesday, 2:00 p.m. ET — the Fed's decision. A surprise hike would likely push rates up; a hold is already priced in, so it may do very little on its own.
What I'd do
If you're under contract and closing within 30 days, this is a reasonable window to lock. You're being offered a small improvement on a rate that spent seven weeks going the wrong way, with a Fed meeting in between. A sure thing beats a maybe on a short timeline.
If you're shopping but haven't found the house, don't try to time this. Inventory is up and competition is down — that is worth more to you right now than a quarter point. Get fully underwritten so you can move quickly when the right listing appears.
If you're sitting on a rate in the 5s or low 6s, there is nothing here for you yet, and that's fine. Keep the loan you have.
If you bought in the last two months at 7.4% or higher, watch this. Refinancing generally starts to make sense when you can cut your rate by about three quarters of a point and stay long enough to earn back the closing costs. We're not there — but it's the first week all autumn the arrow pointed the right way.
Call or email me and we'll run your actual numbers rather than national averages. Averages don't close loans.
REFERENCES
1. Mortgage Bankers Association. Weekly Applications Survey. week ending Oct. 16, 2026; released Oct. 21, 2026. https://www.mba.org/news-and-research/research-and-economics/single-family-research/weekly-applications-survey
2. Freddie Mac. Primary Mortgage Market Survey. released Oct. 15, 2026. https://www.freddiemac.com/pmms
3. Freddie Mac. Mortgage Market Survey Archive. weekly 30-year and 15-year averages, 2026. https://www.freddiemac.com/pmms/archive
4. Associated Press (Alex Veiga). Average long-term US mortgage rate at highest level in nearly 3 years after 7th weekly rise in a row. Oct. 8, 2026. https://finance.yahoo.com/real-estate/articles/freddie-mac-average-rate-30-160152821.html
5. U.S. Department of the Treasury. Daily Treasury Par Yield Curve Rates. October 2026. https://home.treasury.gov/resource-center/data-chart-center/interest-rates/TextView?type=daily_treasury_yield_curve&field_tdr_date_value=202610
6. U.S. Bureau of Labor Statistics. Consumer Price Index — September 2026. released Oct. 14, 2026. https://www.bls.gov/news.release/cpi.nr0.htm
7. U.S. Bureau of Labor Statistics. Producer Price Index — September 2026. released Oct. 15, 2026. https://www.bls.gov/news.release/archives/ppi_10152026.htm
8. Board of Governors of the Federal Reserve System. FOMC Statement. Sept. 16, 2026. https://www.federalreserve.gov/newsevents/pressreleases/monetary20260916a.htm
9. Board of Governors of the Federal Reserve System. H.15 Selected Interest Rates (Daily). released Oct. 20, 2026. https://www.federalreserve.gov/releases/h15/
10. Board of Governors of the Federal Reserve System. Meeting calendars and information. October 2026. https://www.federalreserve.gov/newsevents/2026-october.htm
11. Reuters, via Investing.com. Fed's Warsh sees US resilience, mum on rate-path view. Oct. 16, 2026. https://www.investing.com/news/economy-news/feds-warsh-gives-no-hint-on-october-policy-decision-4953046
12. FXStreet. Markets now see no hike in October, but inflation is still a major concern. CME FedWatch-derived odds, ~15% as of Oct. 16, 2026; published Oct. 19, 2026. https://www.fxstreet.com/analysis/markets-now-see-no-hike-in-october-but-inflation-is-still-a-major-concern-202610191410
13. Forbes (Simon Moore). What To Look For From The Fed's October Meeting. CME FedWatch-derived odds, roughly 8-in-10 hold; Oct. 19, 2026, updated Oct. 20, 2026. https://www.forbes.com/sites/simonmoore/2026/10/19/what-to-look-for-from-the-feds-october-meeting/
14. National Association of Realtors. Existing-Home Sales, September 2026. released Oct. 13, 2026. https://www.nar.realtor/newsroom/existing-home-sales-increased-1-5-in-september-according-to-nar-report
15. Charles Schwab. FOMC Meeting: Fed Hikes in 12-0 Vote, Commits to Inflation Fight. September 2026. https://www.schwab.com/learn/story/fomc-meeting
About these figures. All four figures were produced in-house by Daily Rate News from the published sources named in each caption. Payment figures are calculated using the standard amortization formula. The figures contain no AI-generated imagery and no stock photography, and are free for you to reproduce in this newsletter and in your own marketing.