
Tuesday, October 13, 2026 at 9:25 AM PDT
Mortgage Rates Hit 7.40% — Even Though the Fed Is Expected to Sit Still
The 30-year average is the highest it has been in almost three years. The surprising part: it climbed while traders were giving up on the idea of another Fed rate hike this month. Here is what is really driving your rate, and what tomorrow morning’s inflation report could do to it.
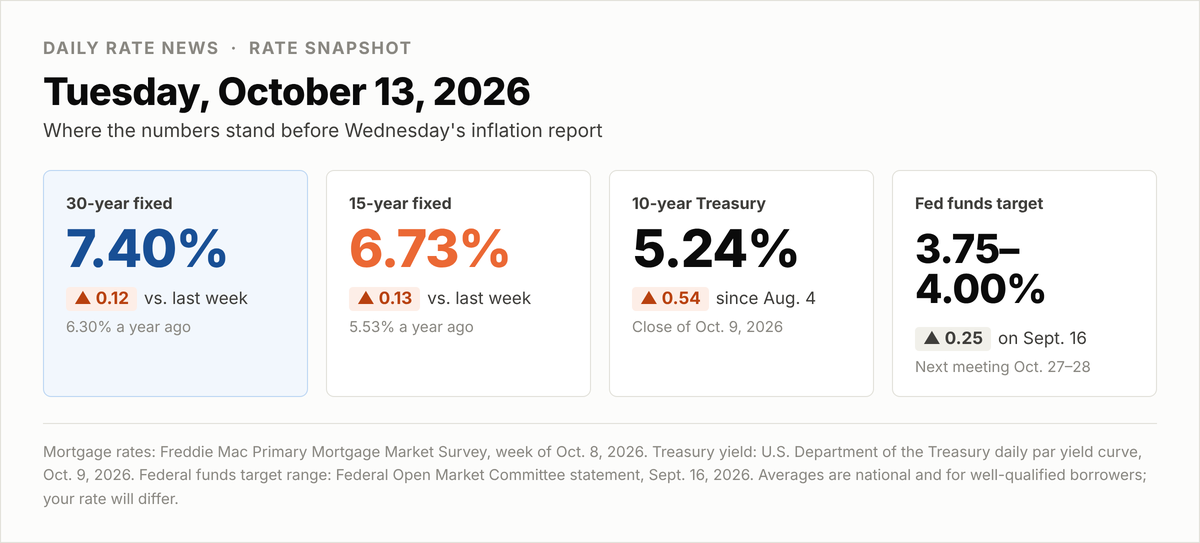
Figure 1. Rate snapshot. Sources: Freddie Mac Primary Mortgage Market Survey, week of Oct. 8, 2026; U.S. Treasury daily par yield curve, Oct. 9, 2026; Federal Open Market Committee statement, Sept. 16, 2026.
Where rates stand this morning
Freddie Mac’s weekly survey put the average 30-year fixed mortgage at 7.40% for the week of October 8, up from 7.28% a week earlier. The 15-year fixed averaged 6.73%, up from 6.60%. A year ago those same averages were 6.30% and 5.53%.
That 7.40% is the highest weekly reading in Freddie Mac’s survey since the week of November 16, 2023, when it was 7.44%. Nothing in 2024 or 2025 came close — 2024 peaked at 7.22% and 2025 peaked at 7.04%.
What makes this year unusual is how fast it happened. Rates started 2026 at 6.16%, bottomed at 5.98% in late February, and were still only 6.76% in early September. Then they went up almost two-thirds of a point in five weeks.
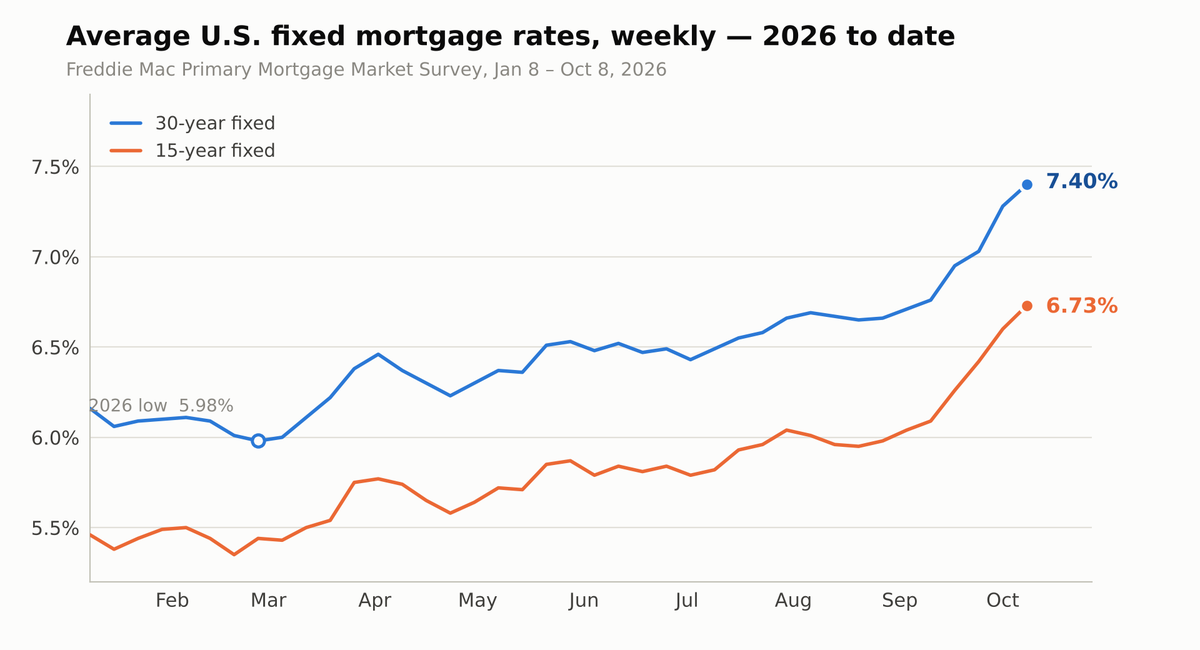
Figure 2. Weekly average 30-year and 15-year fixed mortgage rates, Jan. 8 – Oct. 8, 2026. Source: Freddie Mac Primary Mortgage Market Survey, released Oct. 8, 2026.
Why rates rose while rate-hike bets fell
Here is the part that confuses a lot of people. The Federal Reserve raised its short-term rate at its September 15–16 meeting, to a target range of 3.75%–4.00%. Then on October 2, the Labor Department reported the economy added just 29,000 jobs in September and unemployment ticked up to 4.2%. A weak job market usually argues against more rate increases — and CNBC reported that day that traders had cut the odds of an October hike sharply. Reuters reported on October 12 that investors now expect the Fed to leave rates alone at its October 27–28 meeting.
So why did mortgage rates go up?
Because the Fed does not set mortgage rates. Thirty-year mortgage rates track the 10-year Treasury yield — the interest rate the U.S. government pays to borrow money for ten years. That yield reflects what investors think inflation will do over the next decade, not what the Fed does next month.
And the 10-year has been climbing. It was 4.63% on August 4. It closed at 5.24% on October 9 — about six-tenths of a point higher in nine weeks. Mortgage rates lag that market by a week or two, so Freddie Mac’s survey has been catching up to a bond-market move that mostly happened in late September.
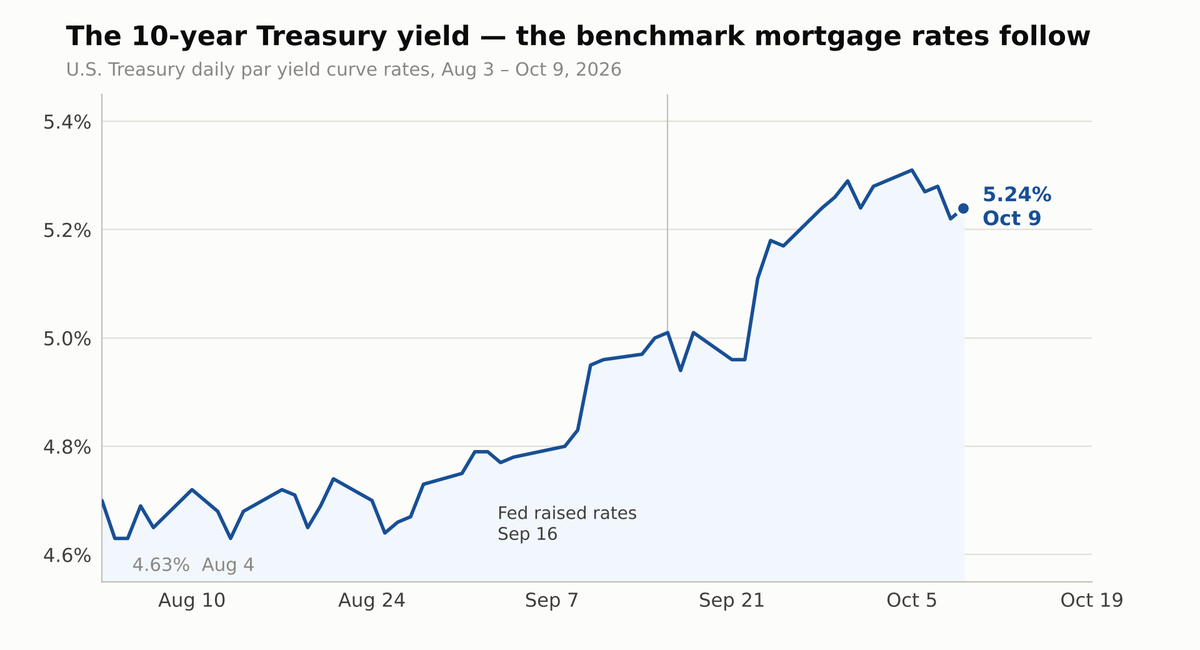
Figure 3. 10-year U.S. Treasury par yield, daily, Aug. 3 – Oct. 9, 2026. Source: U.S. Department of the Treasury, Daily Treasury Par Yield Curve Rates. Oct. 9 is the most recent published close; markets were closed Oct. 12 for Columbus Day.
The inflation problem, in one picture
Bond investors are reacting to one thing above all: prices are still rising faster than the Fed wants.
In the most recent inflation report — August data, released September 11 — the Bureau of Labor Statistics said consumer prices were 3.4% higher than a year earlier. Strip out food and energy, and the “core” rate was 2.4%. The Fed’s goal is 2%.
The gap between those two numbers tells you where the pressure is coming from. Energy prices were up 16.3% over the year, and gasoline alone was up 27.4%. Shelter — rent and the equivalent cost of owning — rose 3.0%, the slowest it has run in years.
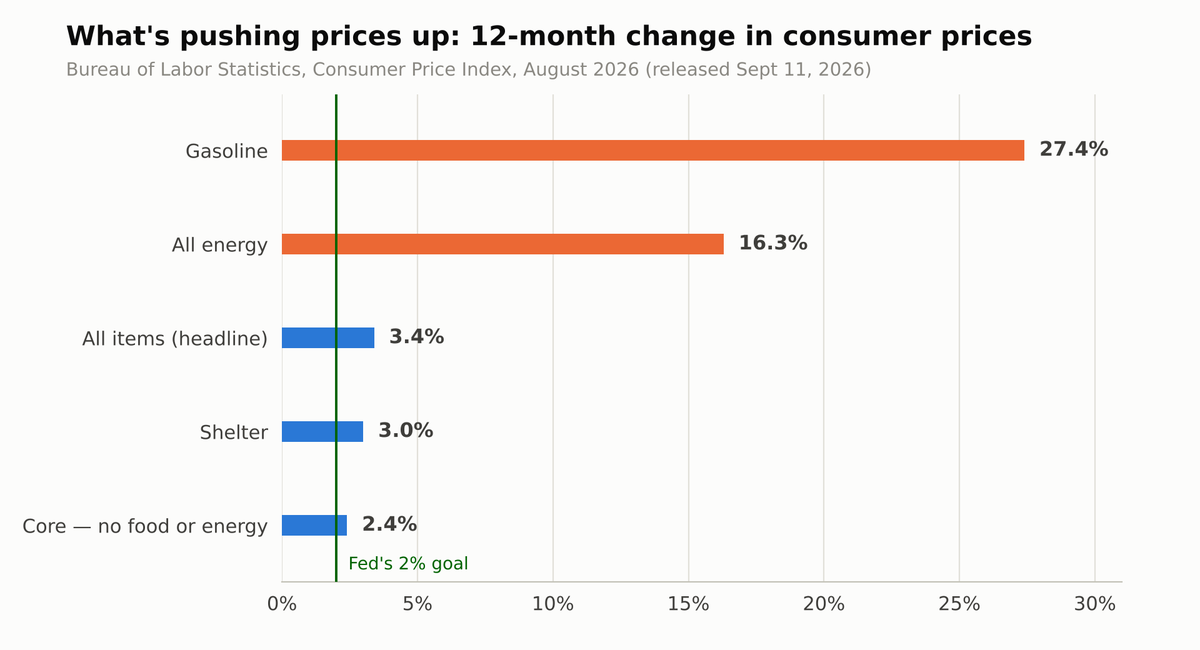
Figure 4. 12-month percent change in selected consumer price categories, August 2026. Source: Bureau of Labor Statistics, Consumer Price Index, released Sept. 11, 2026.
There is one hopeful sign. The Energy Information Administration put the national average for regular gasoline at $4.354 a gallon for the week of October 5, down about 11 cents from the week before. It is still $1.23 above a year ago, but the direction finally changed.
What this costs you in dollars
Rates are easier to understand as a monthly payment. The table below uses the national median existing-home price of $429,100 (National Association of Realtors, August 2026) with 20% down — a loan of $343,280 on a 30-year fixed.
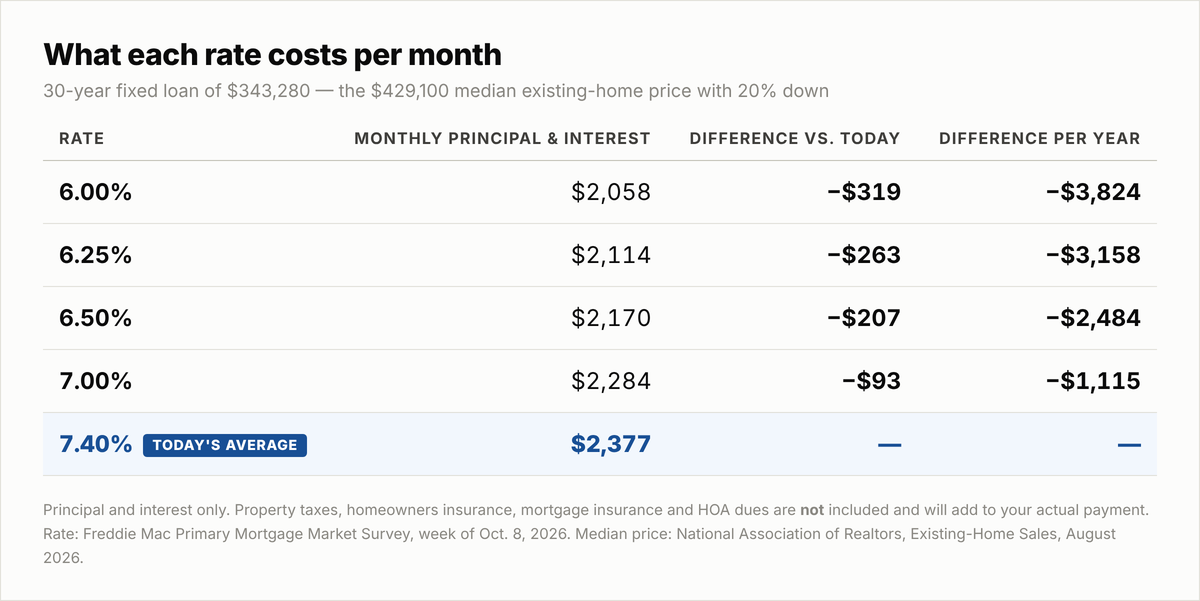
Figure 5. Monthly principal and interest at selected rates on a $343,280 30-year fixed loan. Rate source: Freddie Mac PMMS, week of Oct. 8, 2026. Median price: National Association of Realtors, Existing-Home Sales, August 2026. Taxes, insurance, mortgage insurance and HOA dues excluded.
The practical takeaway: on this loan size, every quarter-point is worth roughly $56 a month, or about $670 a year. If rates eventually came back to 6.50%, that is $207 a month — $2,484 a year — off this payment.
The housing market right now
Existing-home sales ran at an annual pace of 3.98 million in August, down 2.0% from July and 1.2% from a year earlier, per NAR. The median price was $429,100, up just 1.6% from a year ago — barely moving. There were 1.62 million homes for sale, a 4.9-month supply. NAR Chief Economist Lawrence Yun said the supply “is giving homebuyers better opportunities to negotiate.”
Builders have pulled back a little. The Census Bureau reported housing starts at a 1,275,000 annual rate in August, down 2.6% from July, with permits down 2.7%. (Census notes those monthly changes are not statistically significant, so read them as a trend, not a verdict.)
Households are feeling it. The University of Michigan’s preliminary October consumer sentiment index came in at 46.3, down from 48.1 — one of the weakest readings the survey has recorded, as reported by Schwab on October 12.
What to watch this week
• Today, 10:00 a.m. ET — NAR releases September existing-home sales. The August numbers above become last month’s news.
• Tomorrow, 8:30 a.m. ET — the September Consumer Price Index. This is the big one. Analysts expect headline prices to rise 0.6% for the month and core prices 0.2%, per Schwab’s October 12 preview. A hotter number would likely push yields and mortgage rates higher; a cooler one is the clearest path to relief.
• Tomorrow, 2:00 p.m. ET — the Fed’s Beige Book, a region-by-region read on the economy.
• All week — Fed officials speaking. Cleveland Fed President Beth Hammack said on October 12 that “we need to put more restriction in the economy,” though she added that the timing is “an open question.” Markets listen closely to voters like her.
What I’d do
If you’re under contract, lock. With CPI landing tomorrow morning, the next 48 hours carry real two-way risk. A lock removes that risk. If your lender offers a float-down, ask what it costs and what it requires — that is the clean way to keep some upside.
If you’re shopping, get quotes from more than one lender. Freddie Mac’s own survey note makes this point, and it matters more when rates are moving: a quote from Thursday is not a quote from today.
If you’re waiting to refinance, run the break-even now, not later. Divide your total closing costs by your monthly savings. That is how many months you need to stay in the loan for the refinance to pay for itself. Know your number ahead of time so you can act in a day instead of a week if rates drop.
If you’re buying, remember what you’re actually competing for. A 4.9-month supply and flat prices mean sellers are negotiating. Seller-paid closing costs or a rate buydown can be worth more to your monthly payment than a price cut — and unlike the rate, the price you lock in is permanent. You can refinance a rate; you can’t refinance a purchase price.
Questions about where your own numbers land? I’m happy to run them with you.
References
1. Freddie Mac. Primary Mortgage Market Survey. Released Oct. 8, 2026.
https://www.freddiemac.com/pmms
2. Freddie Mac. Mortgage Market Survey Archive (2023, 2024, 2025, 2026). Accessed Oct. 13, 2026.
https://www.freddiemac.com/pmms/archive
3. U.S. Department of the Treasury. Daily Treasury Par Yield Curve Rates. Data through Oct. 9, 2026.
https://home.treasury.gov/resource-center/data-chart-center/interest-rates/TextView?type=daily_treasury_yield_curve&field_tdr_date_value=202610
4. U.S. Bureau of Labor Statistics. Consumer Price Index — August 2026. Released Sept. 11, 2026.
https://www.bls.gov/news.release/cpi.nr0.htm
5. U.S. Bureau of Labor Statistics. The Employment Situation — September 2026. Released Oct. 2, 2026.
https://www.bls.gov/news.release/empsit.nr0.htm
6. Board of Governors of the Federal Reserve System. FOMC Statement. Released Sept. 16, 2026.
https://www.federalreserve.gov/newsevents/pressreleases/monetary20260916a.htm
7. National Association of Realtors. Existing-Home Sales — August 2026. Released Sept. 10, 2026.
https://www.nar.realtor/newsroom/nar-existing-home-sales-report-shows-2-0-decrease-in-august
8. U.S. Census Bureau and U.S. Dept. of Housing and Urban Development. New Residential Construction — August 2026. Released Sept. 17, 2026.
https://www.census.gov/construction/nrc/current/index.html
9. U.S. Energy Information Administration. Gasoline and Diesel Fuel Update. Week of Oct. 5, 2026.
https://www.eia.gov/petroleum/gasdiesel/
10. CNBC. Traders now see little chance of a Fed rate hike in October after weak jobs report. Oct. 2, 2026.
https://www.cnbc.com/2026/10/02/fed-rate-hike-odds-decline-after-september-jobs-report.html
11. Reuters (via Investing.com). Fed’s Hammack: Hope to cool demand, and inflation, without job market pain. Oct. 12, 2026.
https://www.investing.com/news/economy-news/feds-hammack-hope-to-cool-demand-and-inflation-without-job-market-pain-4945244
12. Charles Schwab. Bracing for Busy Week: Bank Earnings, CPI Ahead. Oct. 12, 2026.
https://www.schwab.com/learn/story/stock-market-update-open
All five figures were built for this issue from the published data cited above. They are original, free for you to reproduce in your own newsletter, and contain no AI-generated imagery. If you add a photograph, free-license options include Unsplash, Pexels and Pixabay; photography produced by U.S. government agencies is generally in the public domain.