
Monday, October 12, 2026 at 9:27 AM PDT
Mortgage rates hit 7.40% — and Wednesday's inflation report decides what happens next
The 30-year fixed average has risen seven weeks straight, driven by a bond market worried about oil and inflation. The bond market is closed today for Columbus Day, so nothing moves until Tuesday. Then Wednesday morning brings the number that matters.
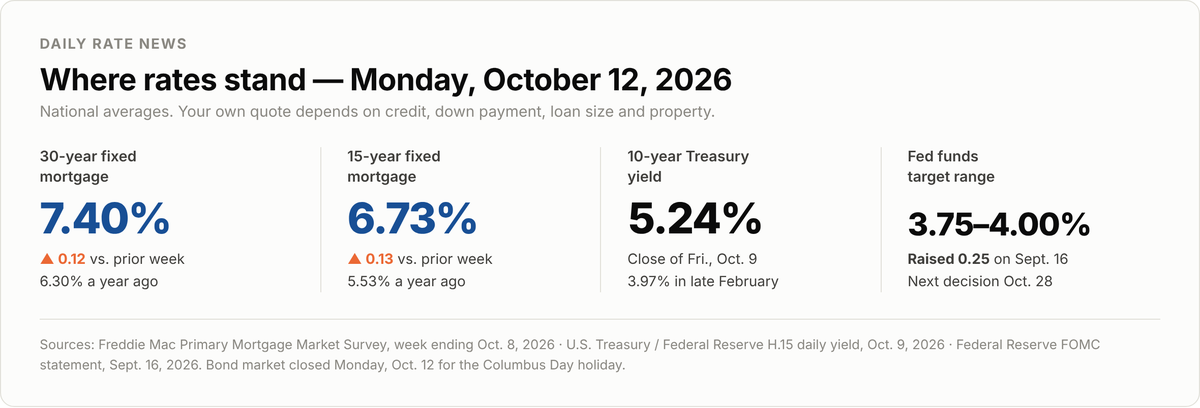
Figure 1. Rate snapshot as of Monday, October 12, 2026. Sources: Freddie Mac Primary Mortgage Market Survey, as of October 8, 2026; U.S. Treasury daily par yield curve, October 9, 2026; Federal Reserve FOMC statement, September 16, 2026.
What happened
Freddie Mac's weekly survey put the average 30-year fixed mortgage rate at 7.40% on October 8, up from 7.28% the week before. The 15-year fixed average rose to 6.73% from 6.60%. A year ago those same averages were 6.30% and 5.53%.
That was the seventh weekly increase in a row, and the highest 30-year average in nearly three years, according to the Associated Press. Back on February 26, the same survey read 5.98% — a level Freddie Mac described at the time as the first time below 6% in three and a half years.
In roughly seven months, the average has climbed about 1.4 percentage points.
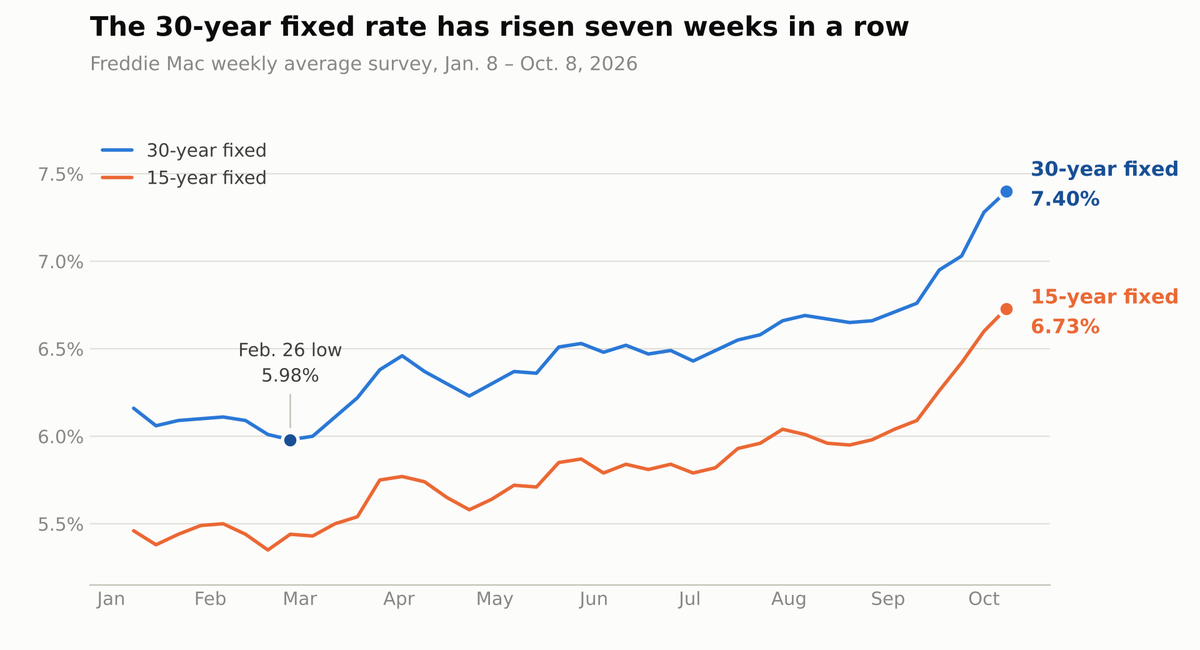
Figure 2. Freddie Mac Primary Mortgage Market Survey, weekly averages, January 8 through October 8, 2026. Source: Freddie Mac PMMS archive, accessed October 12, 2026.
Why rates are climbing
Mortgage rates don't follow the Federal Reserve directly. They follow the 10-year Treasury yield — the interest rate the U.S. government pays to borrow money for ten years. When investors demand more to lend to the government, lenders charge more to lend to you.
That yield closed at 5.24% on Friday, October 9. In late February it was 3.97%. Two things pushed it up.
The first is energy. The war with Iran, which the Associated Press dates to late February, sent crude oil prices sharply higher. U.S. benchmark crude traded in the mid-to-high $90s a barrel in early October, according to Energy Information Administration spot price data. The national average price of regular gasoline was $4.36 a gallon on October 8, per AAA, against about $3.12 a year earlier. AAA also reported that September's monthly average of $4.33 was roughly 50 cents above the previous September record, set in 2023.
Expensive fuel shows up in the inflation numbers. In August — the most recent month reported — the Bureau of Labor Statistics said gasoline was up 27.4% from a year earlier and the overall energy index up 16.3%. Consumer prices overall rose 3.4%.
The second is the Fed. On September 16 the Federal Reserve raised its benchmark rate by a quarter point, to a target range of 3.75% to 4.00% — a reversal after years of cuts and pauses. Minutes of that meeting, released October 7, showed most participants thought another increase would likely be appropriate before the end of the year.
Bond investors have priced that in. CME FedWatch data cited by ABF Journal on October 7 showed roughly a 17% chance of a hike at the Fed's October 28 meeting but about an 84% chance of one by December.
Here's the part worth holding onto: underlying inflation is actually behaving. Strip out food and energy and that same August report showed "core" inflation at 2.4% over the year — down from 2.5% in July. The August personal consumption expenditures report, the Fed's preferred inflation gauge, came in at 3.4% headline and 3.0% core, both below what forecasters expected. The inflation problem is concentrated in the gas pump, not spread across the economy.
That matters, because an oil shock can fade. A broad wage-price spiral doesn't.
What it costs in dollars
The National Association of Realtors put the median existing-home price at $429,100 in August. With 20% down, that's a loan of $343,280.
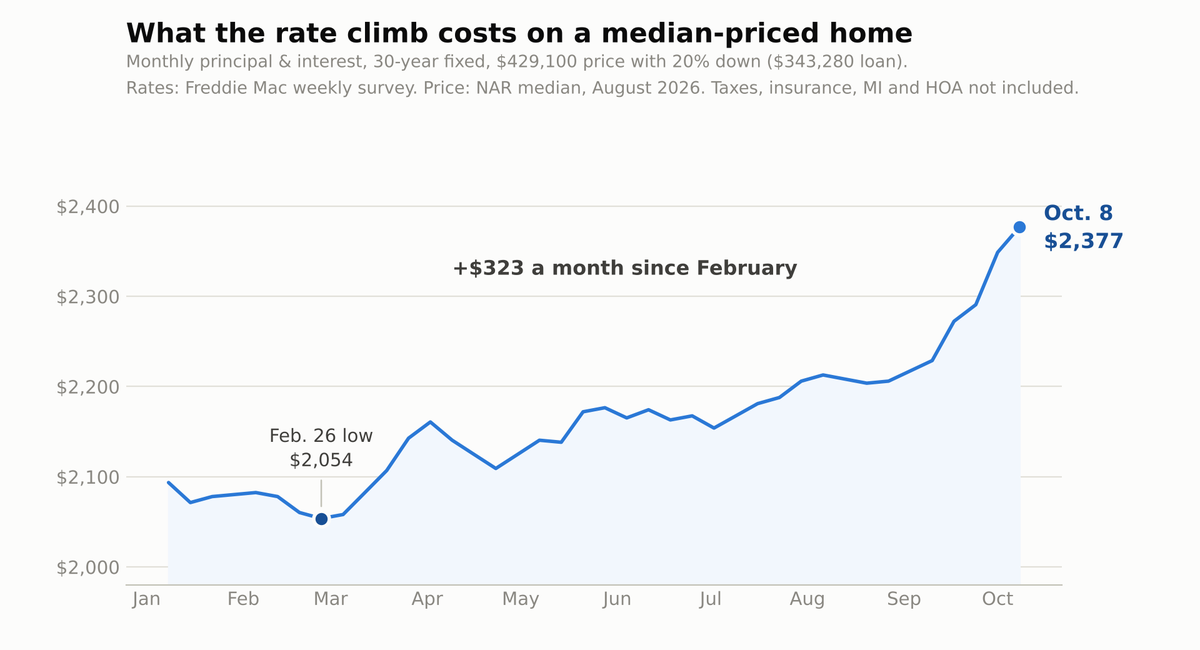
Figure 3. Monthly principal and interest on a $343,280 loan at each week's Freddie Mac 30-year average. Sources: Freddie Mac PMMS weekly averages, 2026; NAR median existing-home price, August 2026 (released September 10, 2026).
At February's 5.98%, principal and interest on that loan ran about $2,054 a month. At 7.40%, it's about $2,377. That's $323 more every month, or roughly $3,877 a year, for the identical house.
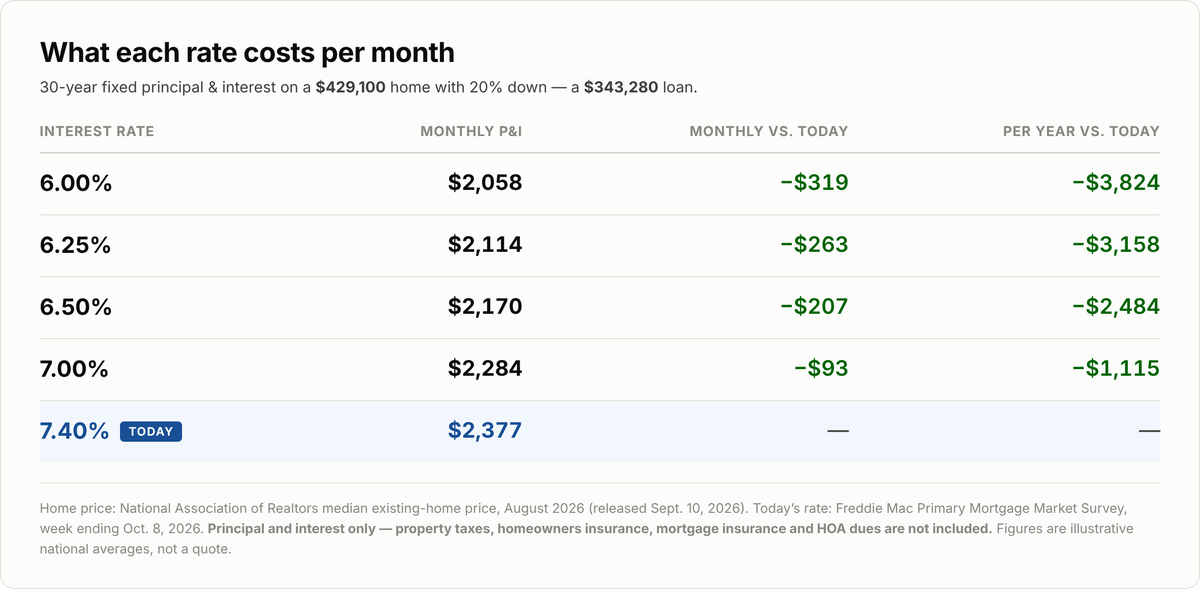
Figure 4. Monthly principal and interest by interest rate on a $343,280 loan (30-year fixed). Rate source: Freddie Mac PMMS, October 8, 2026. Price source: NAR, August 2026.
Run that in reverse and you see what a recovery is worth. Every quarter-point drop in your rate saves roughly $55 a month on a loan this size — about $660 a year. At 6.50%, the payment would fall about $207 a month.
Keep in mind these are principal and interest only. Property taxes, homeowners insurance, mortgage insurance and HOA dues are on top.
The housing market right now
Higher rates are cooling activity, but not collapsing prices. NAR reported existing-home sales ran at an annual pace of 3.98 million in August, down 2.0% from July and 1.2% from a year earlier. Yet the median price was still up 1.6% from a year ago.
The more encouraging number for buyers is inventory: 1.62 million homes for sale, up 3.2% in a single month, which works out to 4.9 months of supply. Homes took a median of 31 days to sell, up from 29 in July. First-time buyers made up 30% of sales, up from 29%.
Fewer competing bids, more homes to pick from, sellers who will negotiate. That's the trade you're being offered for the higher rate.
On the demand side, the Mortgage Bankers Association said applications fell 4.2% in the week ending October 2. Refinance applications dropped 8% and sat 56% below the same week last year.
What to watch this week
Monday, October 12 — Bond market closed for Columbus Day. Stocks trade; mortgage pricing doesn't meaningfully move.
Wednesday, October 14, 8:30 a.m. ET — September Consumer Price Index. This is the week's main event.
Thursday, October 15 — Producer Price Index and September retail sales. Freddie Mac's next weekly rate survey also publishes.
Friday, October 16 — Industrial production.
Ahead: The Fed's next rate decision lands October 28.
Wednesday is the one that counts. A cooler-than-expected CPI gives the bond market room to rally and mortgage rates room to ease. A hot one, especially if core inflation jumps rather than just the energy piece, likely pushes the 30-year back above where it sits now.
What I'd do
If you're under contract to buy, lock. Rates have moved up seven weeks running and the week's calendar is front-loaded with risk. You're not timing the bottom — you're avoiding the wrong side of an 8:30 a.m. number.
If you're shopping, get fully underwritten rather than pre-qualified. If CPI comes in soft and rates dip, the window may be short, and the buyers who can move are the ones already approved. Run your numbers against today's rate, not February's — and lean on the inventory.
If you've been waiting to refinance, nothing this week changes your plan. At these levels, refinancing makes sense only for a specific reason — pulling cash out, dropping mortgage insurance, or getting off an adjustable rate. Let me run your break-even before you pay for an appraisal.
If you have an adjustable-rate loan resetting within 12 months, let's talk this month. The Fed is tightening rather than easing, and the assumption that your reset lands in a friendlier market no longer holds.
Freddie Mac chief economist Sam Khater made a point in the October 8 release worth repeating: shopping around for multiple quotes "can potentially save them thousands over the loan's lifetime." At 7.40%, an eighth of a point matters more than it did at 6%.
Reply to this email with your scenario and I'll run the actual numbers.
References
1. Freddie Mac. Primary Mortgage Market Survey — Mortgage Rates Average 7.40%. Released October 8, 2026. https://www.freddiemac.com/pmms
2. Freddie Mac. PMMS Weekly Archive, 2026. Accessed October 12, 2026. https://www.freddiemac.com/pmms/archive
3. Freddie Mac. Mortgage Rates Drop Below 6% for the First Time in 3.5 Years. Released February 26, 2026. https://freddiemac.gcs-web.com/news-releases/news-release-details/mortgage-rates-drop-below-6-first-time-35-years
4. Associated Press. Freddie Mac: Average rate on a 30-year mortgage rose for 7th straight week to 7.40%, its highest level in nearly 3 years. October 8, 2026. https://finance.yahoo.com/real-estate/articles/freddie-mac-average-rate-30-160152821.html
5. U.S. Department of the Treasury. Daily Treasury Par Yield Curve Rates, 2026. October 9, 2026. https://home.treasury.gov/resource-center/data-chart-center/interest-rates/daily-treasury-rates.csv/2026/all?type=daily_treasury_yield_curve
6. Board of Governors of the Federal Reserve System. FOMC Statement. September 16, 2026. https://www.federalreserve.gov/newsevents/pressreleases/monetary20260916a.htm
7. Board of Governors of the Federal Reserve System. Minutes of the Federal Open Market Committee, September 15–16, 2026. Released October 7, 2026. https://www.federalreserve.gov/monetarypolicy/fomcminutes20260916.htm
8. ABF Journal. Middle Market Debt Weekly: Fed Minutes Point to a December Hike (CME FedWatch pricing as of October 7, 2026). October 12, 2026. https://abfjournal.com/middle-market-debt-weekly-fed-minutes-point-to-a-december-hike
9. U.S. Bureau of Labor Statistics. Consumer Price Index — August 2026. Released September 11, 2026. https://www.bls.gov/news.release/cpi.nr0.htm
10. National Association of Realtors. Existing-Home Sales Report Shows 2.0% Decrease in August. Released September 10, 2026. https://www.nar.realtor/newsroom/nar-existing-home-sales-report-shows-2-0-decrease-in-august
11. Mortgage Bankers Association. Mortgage Applications Decrease in Latest MBA Weekly Survey (week ending October 2, 2026). October 7, 2026. https://www.mba.org/news-and-research/newsroom/news/2026/10/07/mortgage-applications-decrease-in-latest-mba-weekly-survey
12. U.S. Energy Information Administration. Daily Spot Prices — Cushing, OK WTI. Accessed October 12, 2026. https://www.eia.gov/dnav/pet/pet_pri_spt_s1_d.htm
13. AAA. Pump Prices Remain at Record Highs for Autumn. October 8, 2026. https://gasprices.aaa.com/pump-prices-remain-at-record-highs-for-autumn/
14. U.S. Bureau of Economic Analysis / press coverage. Personal Consumption Expenditures Price Index, August 2026. Released September 30, 2026. https://www.bea.gov/data/personal-consumption-expenditures-price-index
15. U.S. Census Bureau. Advance Monthly Retail Trade Release Schedule. Accessed October 12, 2026. https://www.census.gov/retail/release_schedule.html
16. SIFMA. Holiday Schedule — U.S. Bond Market Recommended Close, Columbus Day, October 12, 2026. Accessed October 12, 2026. https://www.sifma.org/resources/general/holiday-schedule/
About the figures. All four figures were generated originally for this issue from the published figures cited in their captions. They contain no AI-generated imagery — every chart and table is computed directly from the source data above. They are free for the sender to reproduce in their own marketing.