
Friday, October 16, 2026 at 11:10 PM PDT
Gas Prices Pushed Inflation Up. Your Mortgage Rate Paid the Price.
Inflation climbed to 3.7% in September, and almost all of the jump came from the pump. But the bond market reacted anyway, and the average 30-year mortgage is stuck at 7.40% — a full 1.13 points higher than it was a year ago. Here's what's really going on underneath the headline, and what it means if you're buying or refinancing right now.
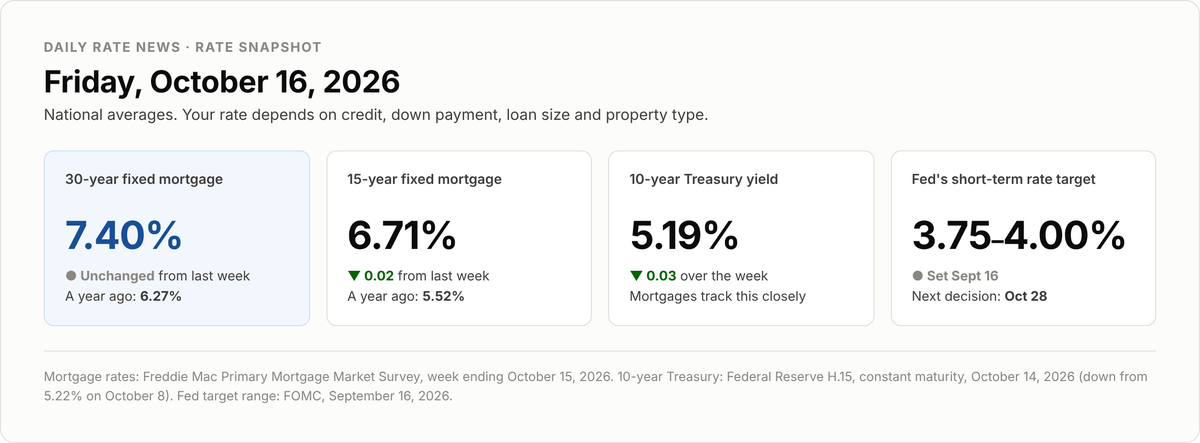
Figure 1. Rate snapshot for October 16, 2026. Sources: Freddie Mac Primary Mortgage Market Survey, released October 15, 2026; Federal Reserve Statistical Release H.15, released October 15, 2026 (yield as of October 14); FOMC statement, September 16, 2026.
What happened this week
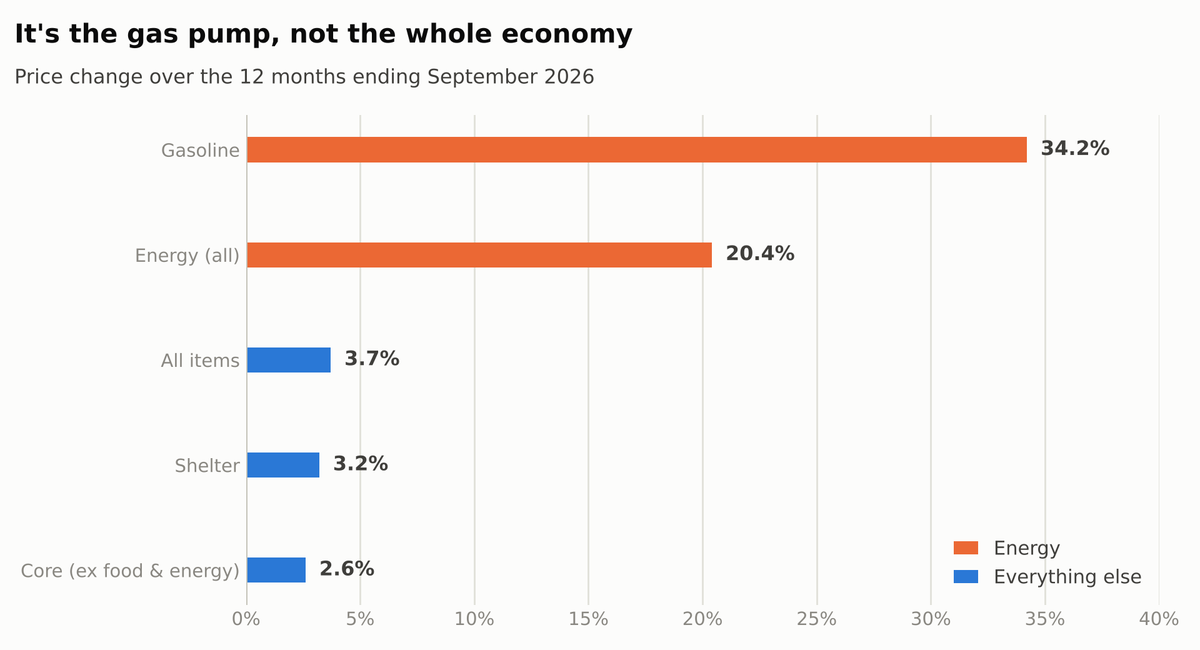
Figure 2. Price change over the 12 months ending September 2026, by category. Source: U.S. Bureau of Labor Statistics, Consumer Price Index — September 2026, released October 14, 2026.
On Wednesday, the Bureau of Labor Statistics reported that consumer prices rose 0.6% in September alone. Over the past 12 months, prices are up 3.7% — a jump from 3.4% the month before.
That is the number that made headlines. But look one layer down and the story changes.
Gasoline prices are up 34.2% over the past year. Energy overall is up 20.4%. Strip food and energy out, and what economists call "core" inflation is running at just 2.6% — close to normal, and barely moving. Shelter costs, which make up the biggest single chunk of the inflation basket, rose 3.2% over the year.
In other words: this is an energy shock working its way through the economy, not a broad-based price spiral. The groceries-and-rent part of inflation is behaving.
The same pattern showed up in Thursday's retail sales report from the Census Bureau. Sales looked strong at first glance — up 0.8% in September. But take out cars and gasoline, and the increase was 0.2% — so small that the Census Bureau cannot distinguish it from zero. A lot of what looked like shoppers spending more was simply shoppers paying more to fill the tank.
Why rates haven't come down
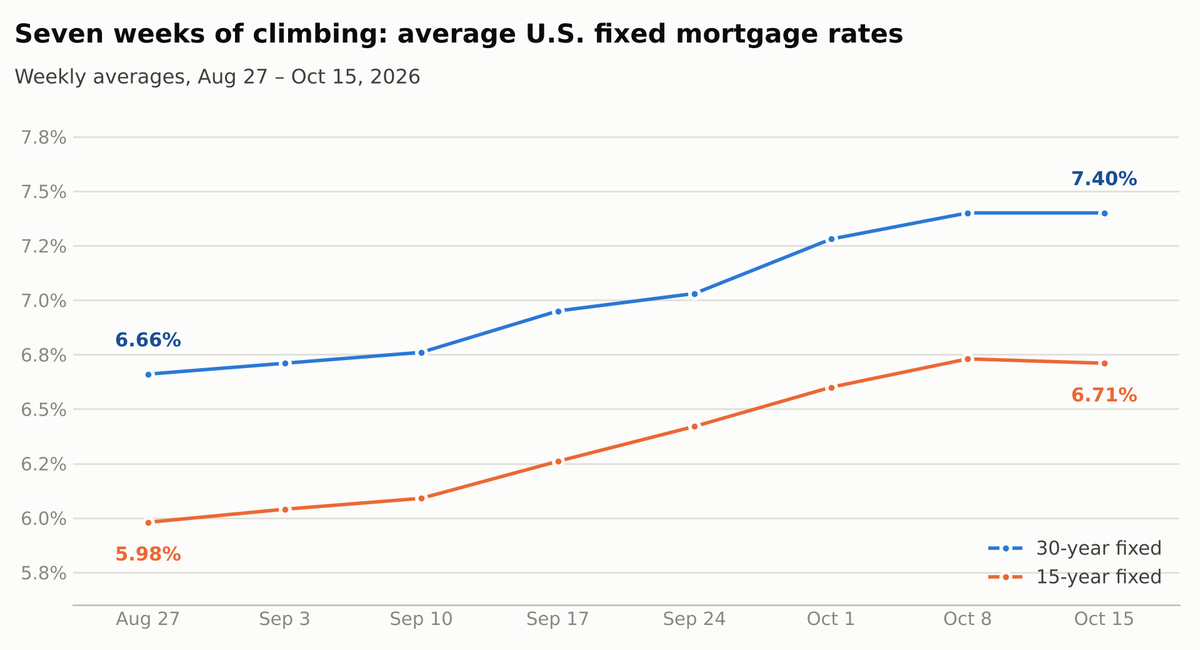
Figure 3. Weekly average 30-year and 15-year fixed mortgage rates, weeks ending August 27 through October 15, 2026. Source: Freddie Mac Primary Mortgage Market Survey.
Here's the frustrating part. Mortgage rates don't take that nuance into account — at least not quickly.
Mortgage rates track the 10-year Treasury yield, which is the interest rate the U.S. government pays to borrow money for 10 years. When investors worry about inflation, they demand a higher return to lend, and that yield rises. Mortgage rates follow it up.
The 10-year yield sat at 5.19% on Wednesday, according to the Federal Reserve's H.15 release. That is why 30-year mortgages are where they are.
And bond investors aren't just reacting to the inflation report. They're reacting to what it does to the Federal Reserve. The Fed raised its short-term rate target to 3.75%–4.00% back on September 16 — its first increase since 2023. After September's inflation reading, traders moved fast. According to CME FedWatch data cited by Forbes, markets put roughly a two-in-three chance on the Fed holding steady at its October 27–28 meeting. For December, the picture is different: Reuters reported Thursday that 12 of 13 major brokerages now expect another quarter-point hike at the Fed's December 8–9 meeting, with Bank of America looking for a half-point of increases spread across both meetings.
It's worth being clear about something, because it's a common source of confusion: the Fed does not set mortgage rates. It sets a short-term rate that banks charge each other overnight. Mortgage rates are set by bond investors making bets about inflation years into the future. That's why mortgage rates often move before the Fed does — and sometimes in the opposite direction.
What this costs in real dollars
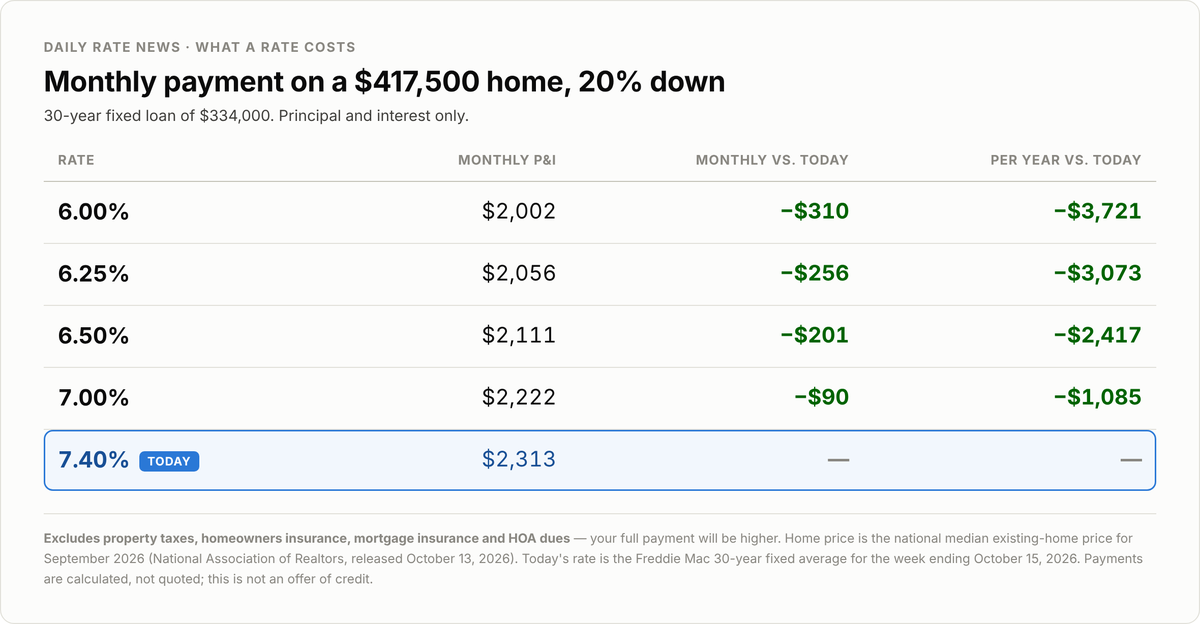
Figure 4. Monthly principal and interest on a $334,000 30-year fixed loan at five rates. Home price is the National Association of Realtors median existing-home price for September 2026, released October 13, 2026; today's rate is the Freddie Mac 30-year average for the week ending October 15, 2026. Payments calculated by Daily Rate News.
The national median existing-home price was $417,500 in September, per the National Association of Realtors. With 20% down, that's a loan of $334,000.
At today's 7.40% average, principal and interest run about $2,313 a month. At 6.00%, the same loan would cost $2,002 — a difference of $310 every month, or $3,721 a year.
That gap is the whole ballgame for most buyers right now. It's not that homes got dramatically more expensive — median prices are up only 1.3% from a year ago. It's that borrowing got more expensive. The 30-year average has climbed from 6.66% in late August to 7.40% today, a rise of nearly three-quarters of a percentage point in seven weeks. A year ago it was 6.27%.
The housing market, briefly
The market is softer, but not frozen.
Existing-home sales rose 1.5% in September to an annual pace of 3.99 million, snapping a three-month decline — though sales are still down 2.2% from a year ago, and August's figure was revised downward, which makes September's gain look a little better than it is.
Inventory is up. There were 1.60 million homes for sale, a 4.8-month supply. That is meaningfully more choice than buyers had during the frantic years, and it's why price growth has cooled to a crawl.
Homes are sitting longer. The typical listing took 33 days to go under contract, up from 31 in August.
First-time buyers made up 31% of sales.
NAR's chief economist Lawrence Yun put the problem plainly: "Further increases in mortgage rates in recent weeks mean fewer buyers can qualify to purchase a home."
Consumers feel it. The University of Michigan's consumer sentiment index fell to 46.3 in early October, a five-month low, with households expecting 4.7% inflation over the year ahead.
What to watch
The Fed meets October 27–28. Most forecasters expect no change. Watch the statement language more than the decision — it will hint at December.
Energy prices. Because this inflation episode is mostly fuel, a stretch of stable or falling gas prices could cool the headline number quickly, and bond yields with it.
The job market. Hiring has nearly stalled: employers added just 29,000 jobs in September, against a 12-month average of 45,000, and unemployment ticked up to 4.2% from 4.1%. A weakening labor market pushes the Fed the other way, toward patience. This tug-of-war is the main reason rates have gone sideways rather than straight up this past week.
What I'd do right now
If you're buying: Don't wait for a number. Waiting for rates to drop has been a losing strategy for a year, and the inventory you have to choose from today is the best in a while. Get your pre-approval current, shop hard on price, and ask me about a rate buydown — in this market, seller-paid points often do more for your payment than a price cut would.
If you locked recently: Stay locked. A float at these levels is a coin flip with real money on it.
If you're waiting to refinance: Set a target and let me watch it for you. If rates return to 6.50% — not a forecast, just a level worth naming — the loan above drops about $201 a month. Know your break-even point before that day comes, so you can move the same week instead of the same quarter.
If you're sitting on a 3% mortgage: Keep it. If you need cash, a second mortgage or HELOC almost always beats refinancing your whole balance at today's rates.
Rates move daily, and national averages are not your rate. If you want a real number for your actual situation, reply to this email and I'll run it.
References
1. Freddie Mac. Primary Mortgage Market Survey. Released October 15, 2026. https://www.freddiemac.com/pmms
2. U.S. Bureau of Labor Statistics. Consumer Price Index — September 2026. Released October 14, 2026. https://www.bls.gov/news.release/archives/cpi_10142026.htm
3. U.S. Bureau of Labor Statistics. The Employment Situation — September 2026.Released October 2, 2026. https://www.bls.gov/news.release/archives/empsit_10022026.htm
4. U.S. Census Bureau. Advance Monthly Sales for Retail and Food Services, September 2026. Released October 15, 2026. https://www.census.gov/retail/marts/www/marts_current.pdf
5. Board of Governors of the Federal Reserve System. Statistical Release H.15 — Selected Interest Rates. Released October 15, 2026. https://www.federalreserve.gov/releases/h15/
6. Federal Open Market Committee. Statement and 2026 Meeting Calendar. Released September 16, 2026. https://www.federalreserve.gov/monetarypolicy/fomccalendars.htm
7. National Association of Realtors. Existing-Home Sales, September 2026. Released October 13, 2026. https://www.nar.realtor/newsroom/existing-home-sales-increased-1-5-in-september-according-to-nar-report
8. University of Michigan Surveys of Consumers. Preliminary Results for October 2026.Released October 9, 2026. http://www.sca.isr.umich.edu/
9. Forbes. Fed 66% Likely To Hold Rates Steady Following High Inflation Data (CME FedWatch data). Released October 14, 2026. https://www.forbes.com/sites/digital-assets/2026/10/14/fed-66-likely-to-hold-rates-steady-following-high-inflation-data/
10. Reuters. Factbox: Major brokerages expect next Fed rate hike in December.Released October 15, 2026. https://kfgo.com/2026/10/15/factbox-major-brokerages-expect-next-fed-rate-hike-in-december/
A note on the figures. All figures in this issue were produced by Daily Rate News from the published government and industry releases cited above. They are original work, free for you to reproduce in your own newsletter, and contain no AI-generated imagery. Charts and tables are computed directly from the source figures. Photo slots are left empty. If you add a photo, free-license options include Unsplash, Pexels and Pixabay; photography produced by U.S. government agencies is generally in the public domain. Always fill in the credit field.