
Monday, October 19, 2026 at 6:50 AM PDT
Bond Yields Just Had Their Best Week in Over a Year. Mortgage Rates Haven't Caught Up Yet.
The 10-year Treasury — the thing your mortgage rate actually follows — dropped sharply late last week. The weekly mortgage survey closed before that happened. Here's what that gap means for you, and the one thing that could close it the wrong way.
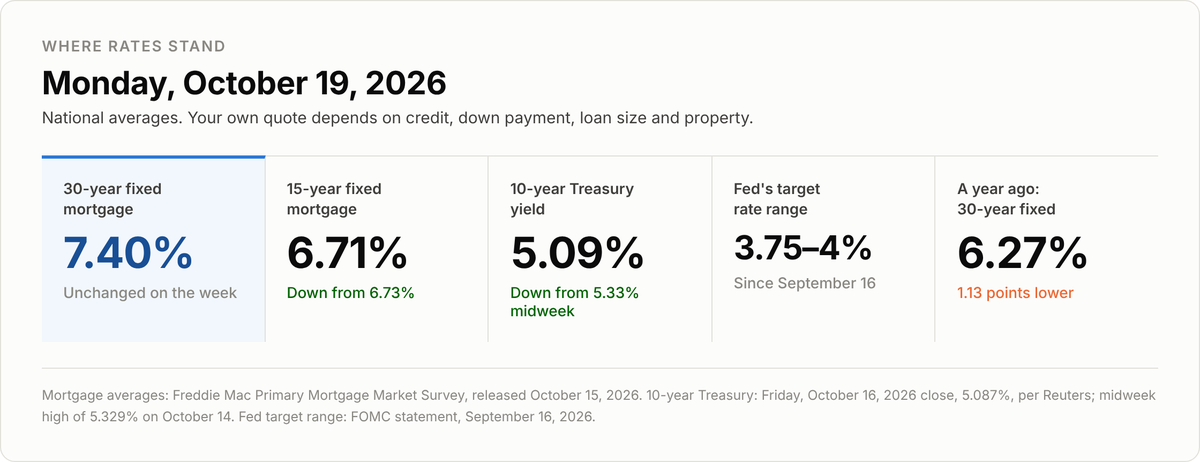
Figure 1. Rate snapshot for Monday, October 19, 2026. Mortgage averages from the Freddie Mac Primary Mortgage Market Survey released October 15, 2026; 10-year Treasury from the October 16, 2026 close; Fed target range from the FOMC statement of September 16, 2026.
What happened at the end of last week
Last week started badly for anyone hoping rates would come down. On Wednesday, the government reported that consumer prices rose 0.6% in September and 3.7% over the past year — hotter than forecasters expected (U.S. Bureau of Labor Statistics, released October 14). The 10-year Treasury yield, which is the benchmark that 30-year mortgage rates track most closely, spiked to 5.329% that day.
Then it reversed. By Thursday the 10-year had touched 5.037%, and it closed Friday at 5.087%. That was the biggest one-week drop in the 10-year yield since the week ending August 1, 2025, according to Reuters.
Three things pushed it down. Investors got nervous about heavily indebted artificial-intelligence companies and moved money into the safety of Treasury bonds. Buyers stepped in after yields hit their highest levels in decades earlier this month. And Fed Chair Kevin Warsh, speaking Friday, declined to signal what the Fed will do at its meeting, saying he does not "prejudge" decisions.
When Treasury yields fall, mortgage rates usually follow within days — but the published survey average hasn't reflected last week's drop yet.
Why the headline number still says 7.40%
Freddie Mac's weekly survey — the number you see quoted in the news — came out Thursday at noon and put the 30-year fixed at 7.40%, unchanged from the week before. The 15-year fixed slipped to 6.71% from 6.73%.
But that survey collects its data earlier in the week. It largely missed Thursday afternoon and Friday. The next reading comes out Thursday, October 22.
Here's the longer trend. The 30-year average climbed 0.74 percentage points in six weeks, from 6.66% on August 27 to 7.40% by October 8, and has now sat flat for two weeks.
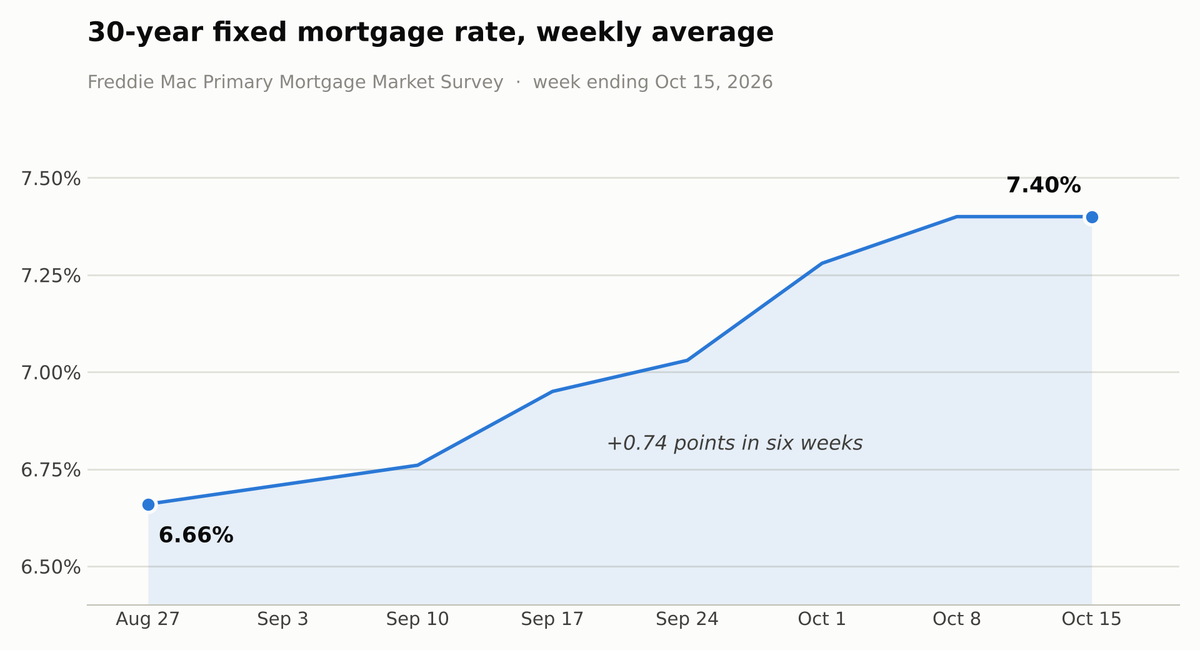
Figure 2. Weekly 30-year fixed-rate mortgage averages, August 27 through October 15, 2026. Source: Freddie Mac Primary Mortgage Market Survey, week ending October 15, 2026.
A year ago, that same 30-year average was 6.27%. So rates are 1.13 percentage points higher than they were last October.
The real driver is sitting in your gas tank
It's worth understanding why rates climbed, because it explains what could happen next.
Inflation is not broadly out of control. Core inflation — the measure that strips out food and energy, which bounce around a lot — rose just 2.6% over the past year. Shelter costs rose 3.2%. Both are close to normal.
Energy is the problem. Gasoline prices were up 34.2% over 12 months. Energy overall was up 20.4% (U.S. Bureau of Labor Statistics, September CPI, released October 14).
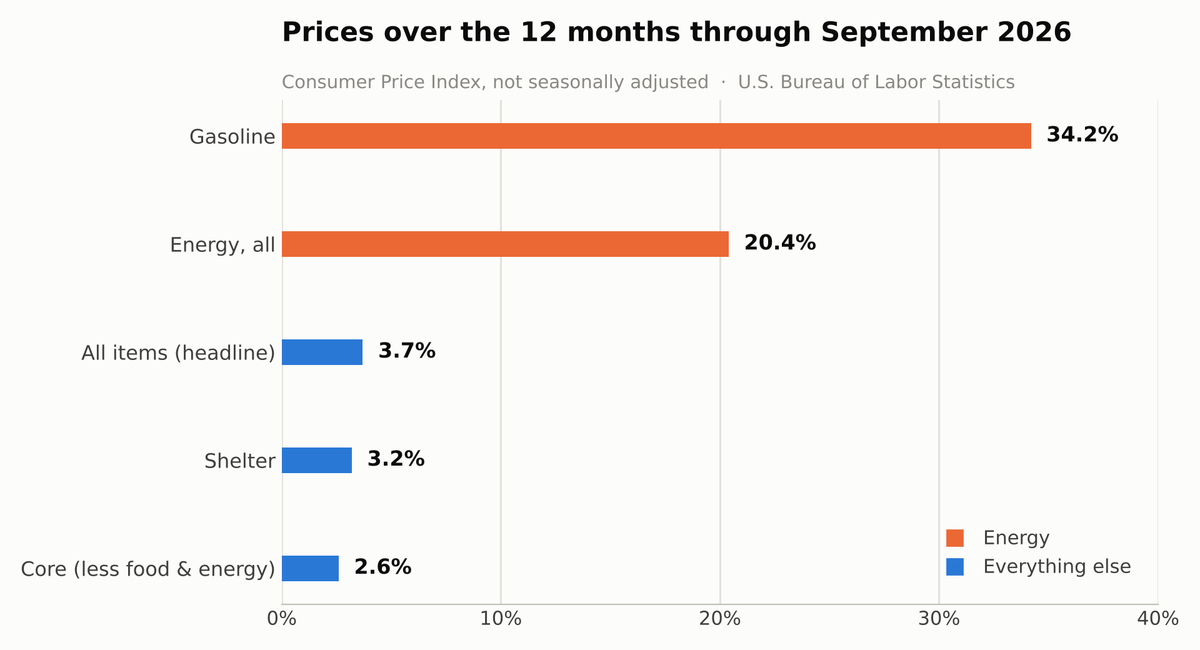
Figure 3. Twelve-month price changes by category, September 2026, not seasonally adjusted. Source: U.S. Bureau of Labor Statistics, Consumer Price Index, released October 14, 2026.
That energy spike traces back to the conflict around the Strait of Hormuz, the narrow waterway that a large share of the world's oil passes through. Oil shipments through it ran at 11.6 million barrels a day in the week to October 13 — about 68% of the pre-conflict level, according to shipping-data firm Kpler, cited by Al Jazeera. Attacks on ships picked up again over the weekend. Brent crude settled Friday at $109.86 a barrel, up 4.91% for the week — its highest settlement since May.
This matters to your mortgage in a specific way. High energy prices keep headline inflation elevated. Elevated inflation makes bond investors demand higher yields. Higher yields mean higher mortgage rates. If oil keeps climbing this week, last week's bond rally can unwind just as fast as it arrived.
What this costs in real dollars
The median existing home sold for $417,500 in September (National Association of Realtors, released October 13). With 20% down, that's a loan of $334,000.
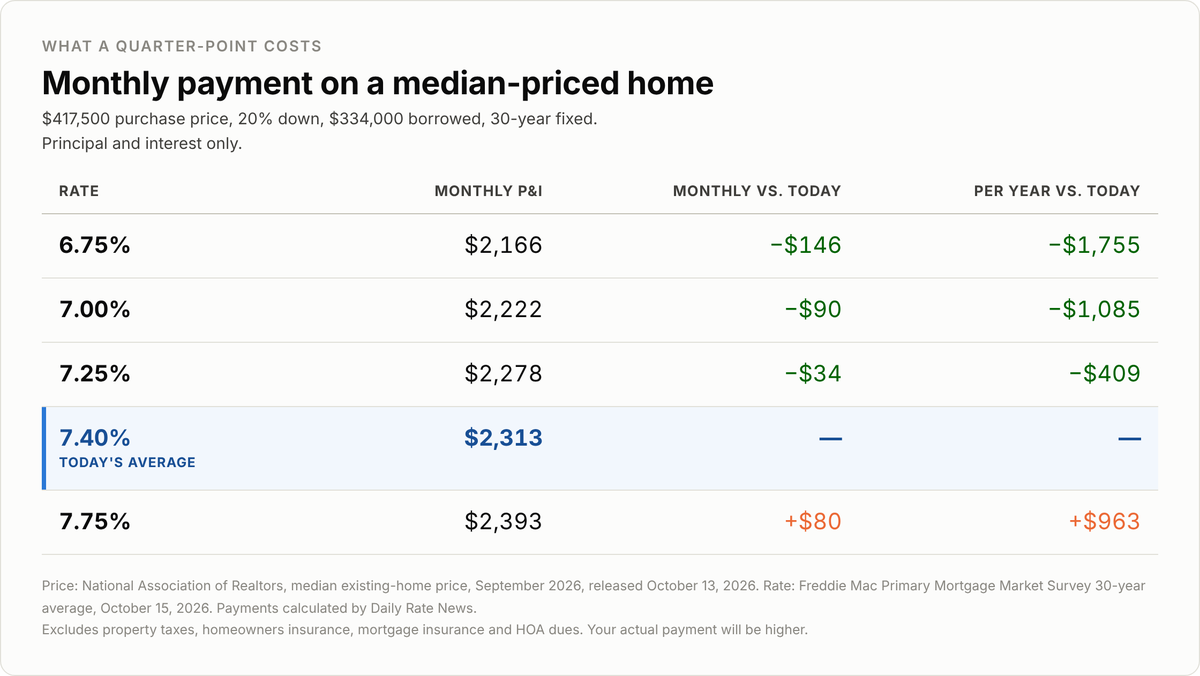
Figure 4. Monthly principal and interest on a $334,000 30-year fixed loan at selected rates. Price from the National Association of Realtors median existing-home price for September 2026, released October 13, 2026; today's rate from the Freddie Mac survey of October 15, 2026. Calculations by Daily Rate News.
At today's 7.40% average, principal and interest run about $2,313 a month. At last October's 6.27%, the same loan would have cost about $2,061 — roughly $252 less each month, or about $3,020 a year.
Around current levels, every quarter-point change is worth about $57 a month on a loan this size. That's why a move that looks small on paper is worth paying attention to.
The housing market, briefly
Existing-home sales actually ticked up 1.5% in September to an annual pace of 3.99 million, though that's still 2.2% below a year ago. NAR Chief Economist Lawrence Yun noted that "August and September marked the two slowest months for home sales this year," and warned that "further increases in mortgage rates in recent weeks mean fewer buyers can qualify to purchase a home."
The good news for buyers is choice. Inventory rose to 1.60 million homes, a 4.8-month supply. Homes took a median 33 days to sell. First-time buyers made up 31% of sales, and 27% paid cash.
Consumers, meanwhile, are gloomy. The University of Michigan's sentiment index fell to 46.3 in its preliminary October reading, down from 48.1 in September and 53.6 a year ago. Survey director Joanne Hsu said "buying conditions for durables plummeted amid high prices and borrowing costs."
What to watch this week
The Fed has gone quiet. Officials entered their pre-meeting blackout on Saturday, October 17, and won't speak publicly until October 29. The Fed meets October 27–28.
Markets have largely made up their minds about that meeting. As of Friday, they put roughly an 83% chance on the Fed leaving rates alone this month, and about an 88% chance of a quarter-point increase in December (Reuters, citing LSEG data, October 16). Twelve major brokerages now forecast a December hike, Reuters reported on October 15. The Fed raised its target range to 3.75%–4.00% on September 16.
With the Fed silent, data moves rates. This week brings:
Monday: Homebuilder sentiment for October
Tuesday: Housing starts and building permits for September; pending home sales
Thursday: Weekly unemployment claims
Friday: Flash business activity surveys, and the final October consumer sentiment reading with fresh inflation expectations
And all week: oil headlines.
What I'd do
If you're under contract, last week's bond move opened a small window. Ask me where pricing is right now rather than going by Thursday's survey number — the two have drifted apart. If a lock makes sense, this is a reasonable moment to take one.
If you're shopping, get fully underwritten now so you can move in a day, not a week. With inventory at a 4.8-month supply and homes sitting 33 days, you have negotiating room you didn't have two years ago. Ask sellers about a rate buydown — in a slow market, many will pay for one.
If you already own, there's nothing to refinance into at these levels. But if you carry high-rate credit card or auto debt and have real equity, it's worth running the numbers. If you bought near 7.40% or higher, I'll call you the moment a refinance pencils out.
One caution. The bond market calmed down last week, but nothing underneath it got fixed. Inflation is still 3.7%, the Fed is still leaning toward raising rates in December, and oil is near $110. Treat any dip in rates as an opportunity to act, not as the start of a trend.
Call me and we'll look at your actual numbers.
References
1. Freddie Mac. Primary Mortgage Market Survey — Mortgage Rates Hold Steady at 7.40%. Released October 15, 2026. https://www.freddiemac.com/pmms
2. U.S. Bureau of Labor Statistics. Consumer Price Index — September 2026.Released October 14, 2026. https://www.bls.gov/news.release/cpi.nr0.htm
3. Board of Governors of the Federal Reserve System. H.15 Selected Interest Rates (Daily). Release dated October 16, 2026. https://www.federalreserve.gov/releases/h15/
4. Board of Governors of the Federal Reserve System. Federal Open Market Committee Statement. September 16, 2026. https://www.federalreserve.gov/monetarypolicy/files/monetary20260916a1.pdf
5. Reuters. US Treasuries: Ten-year yields set for biggest weekly loss in more than a year. October 16, 2026. https://www.brecorder.com/news/40444850/us-treasuries-ten-year-yields-set-for-biggest-weekly-loss-in-more-than-a-year
6. Reuters. Factbox: Major brokerages expect next Fed rate hike in December.October 15, 2026. https://kfgo.com/2026/10/15/factbox-major-brokerages-expect-next-fed-rate-hike-in-december/
7. National Association of Realtors. Existing-Home Sales Increased 1.5% in September. Released October 13, 2026. https://www.nar.realtor/newsroom/existing-home-sales-increased-1-5-in-september-according-to-nar-report
8. University of Michigan Surveys of Consumers. Preliminary Results for October 2026. Released October 9, 2026. https://www.sca.isr.umich.edu/
9. Al Jazeera. US and Iran both claim control of Strait of Hormuz amid attacks on vessels. October 17, 2026. https://www.aljazeera.com/news/2026/10/17/us-and-iran-both-claim-control-of-strait-of-hormuz-amid-attacks-on-vessels
10. EnergyNow. Oil Surges as Middle East Supply Fears Push Brent Near $110 and WTI Above $100. October 16, 2026. https://energynow.com/2026/10/oil-surges-as-middle-east-supply-fears-push-brent-near-110-and-wti-above-100-both-post-strong-weekly-gains/
11. Kiplinger. What to Look Out for in Economic Data This Week (October 19–23). https://www.kiplinger.com/investing/economy/this-weeks-economic-calendar
12. Federal Reserve. FOMC Meeting Calendar. https://www.federalreserve.gov/monetarypolicy/fomccalendars.htm
About the figures. Figures 1 through 4 were created by Daily Rate News from the published figures cited in each caption. They are original work and free for you to reproduce in your own newsletter, website or client materials. They contain no AI-generated imagery. Payment calculations in Figure 4 are standard amortization math performed by Daily Rate News on the cited rate and price.
This is not a commitment to lend. Rates shown are national averages from the sources named beside each figure and are not an offer or a guarantee of a rate available to you. Your rate depends on your credit, income, assets, loan amount, loan-to-value, occupancy, property type and the date and time you lock. Rates and terms change daily and can change without notice. Payment examples cover principal and interest only and exclude property taxes, homeowners insurance, mortgage insurance and HOA dues, so your actual payment will be higher. All loans are subject to underwriting approval. Nothing here is financial, tax or legal advice.