
Tuesday, October 6, 2026 at 7:59 AM PDT
A Weak Jobs Report Used to Mean Cheaper Mortgages. Last Friday It Didn’t.
Hiring nearly stalled in September — and mortgage rates went up anyway. The 30-year average is now 7.28%, almost a full point higher than a year ago. Here’s what changed in the bond market, what it costs you per month, and what I’d do about it right now.
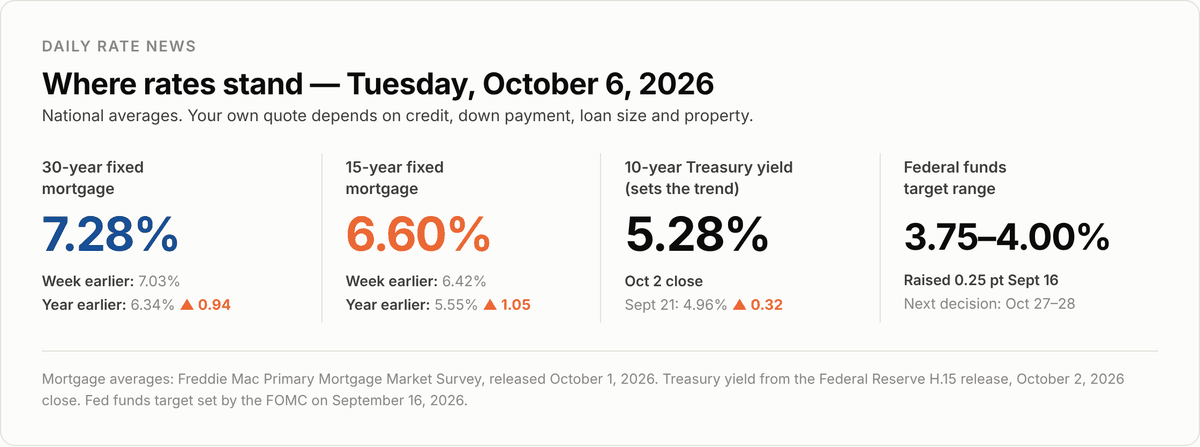
Figure 1. Rate snapshot. Mortgage averages: Freddie Mac Primary Mortgage Market Survey, released October 1, 2026. Treasury yield: Federal Reserve Statistical Release H.15, October 2, 2026 close. Fed funds target: FOMC, September 16, 2026.
What happened
On Friday, the Labor Department reported that employers added just 29,000 jobs in September. That is a very small number — in a healthy month you’d expect something closer to 150,000. The unemployment rate was 4.2%.
It got worse in the fine print. The government revised its earlier counts and found 60,000 fewer jobs than it first reported for July and August combined. July actually went negative: the economy lost 10,000 jobs that month.
For most of the last 20 years, that report would have been good news for anyone shopping for a mortgage. A weak economy usually pushes mortgage rates down. Investors buy safe government bonds when they get nervous, and heavy buying pushes bond yields — and mortgage rates with them — lower.
That is not what happened. Yields dipped for a few minutes, then climbed. The 10-year Treasury yield, the single best predictor of where 30-year mortgage rates go, rose about four hundredths of a point to 5.28% on the day of the report, according to the Federal Reserve’s H.15 release. Mortgage rates rose right along with it.
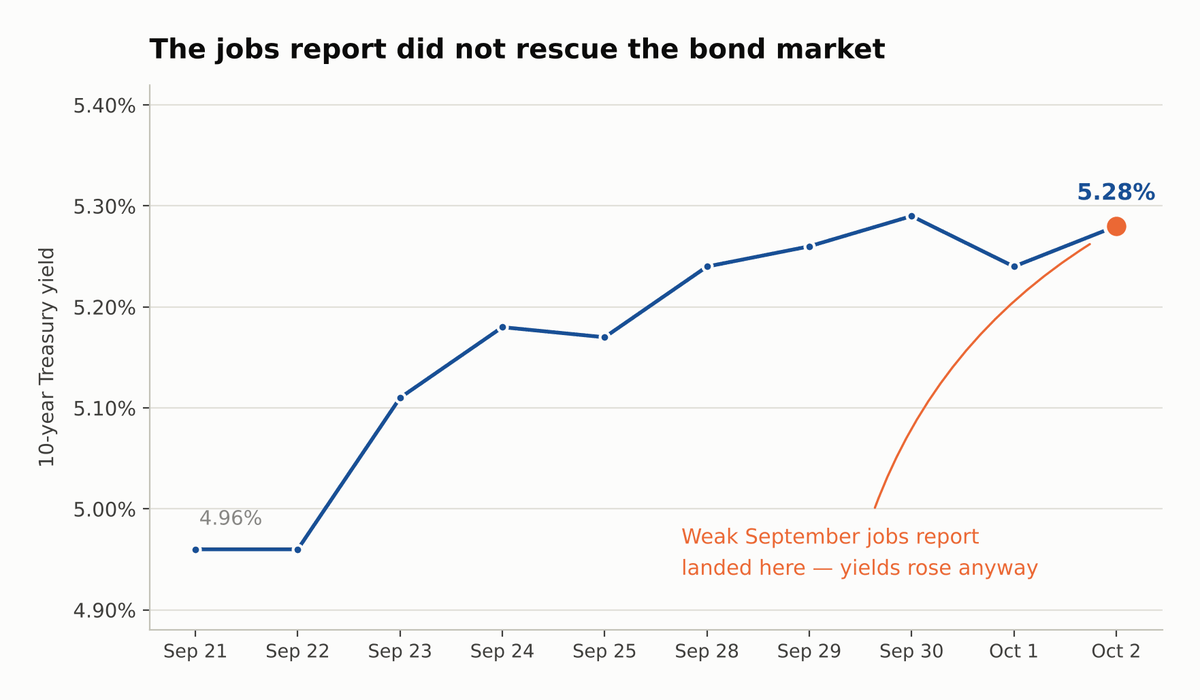
Figure 2. 10-year Treasury constant maturity yield, daily closes. Source: Federal Reserve Statistical Release H.15, data through October 2, 2026.
Why rates didn’t fall
Bond investors are not really betting on whether the economy is strong. They are betting on inflation — because inflation is what eats the value of a bond they’ll hold for ten years.
And inflation is still the problem. In the most recent Consumer Price Index report, covering August, prices were up 3.4% from a year earlier. Energy was the reason. Gasoline alone was up 27.4% from a year earlier, according to the Bureau of Labor Statistics, after a summer of conflict in the Middle East disrupted oil shipments. AAA says the national average for regular gasoline averaged $4.33 a gallon in September — a record for that month, 50 cents above the previous September high set in 2023.
The Federal Reserve responded on September 16 by raising its benchmark rate a quarter point, to a target range of 3.75%–4.00%. That was a rate hike, not a cut.
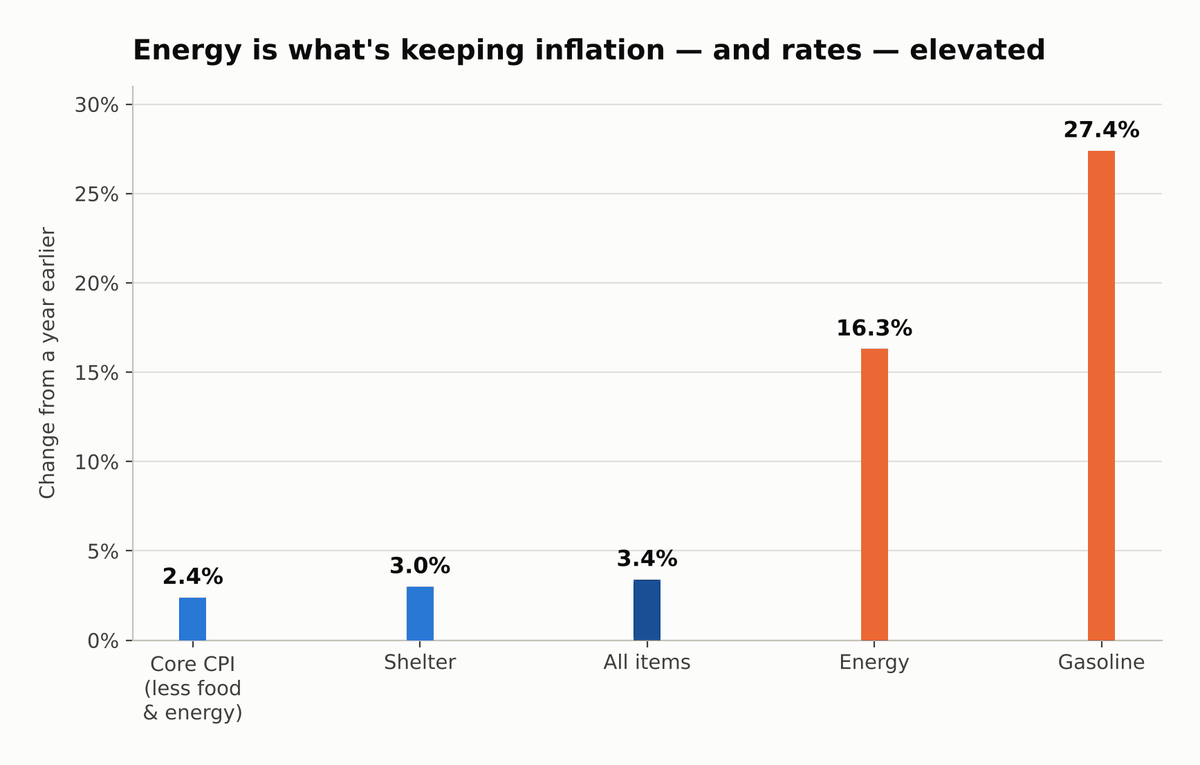
Figure 3. Consumer Price Index, change from a year earlier, by category. Source: U.S. Bureau of Labor Statistics, Consumer Price Index — August 2026, released September 11, 2026.
So here is the thing worth holding on to: when inflation is the economy’s main problem, bad economic news no longer automatically makes mortgages cheaper. Weak hiring tells investors the Fed may stop raising rates — and after Friday’s report, CME FedWatch showed the odds of another hike this month falling from roughly 70% in late September to around 15–20%. But that only affects short-term rates. Your mortgage is priced off the 10-year bond, and the 10-year is still worried about gas prices, government borrowing, and whether inflation sticks around.
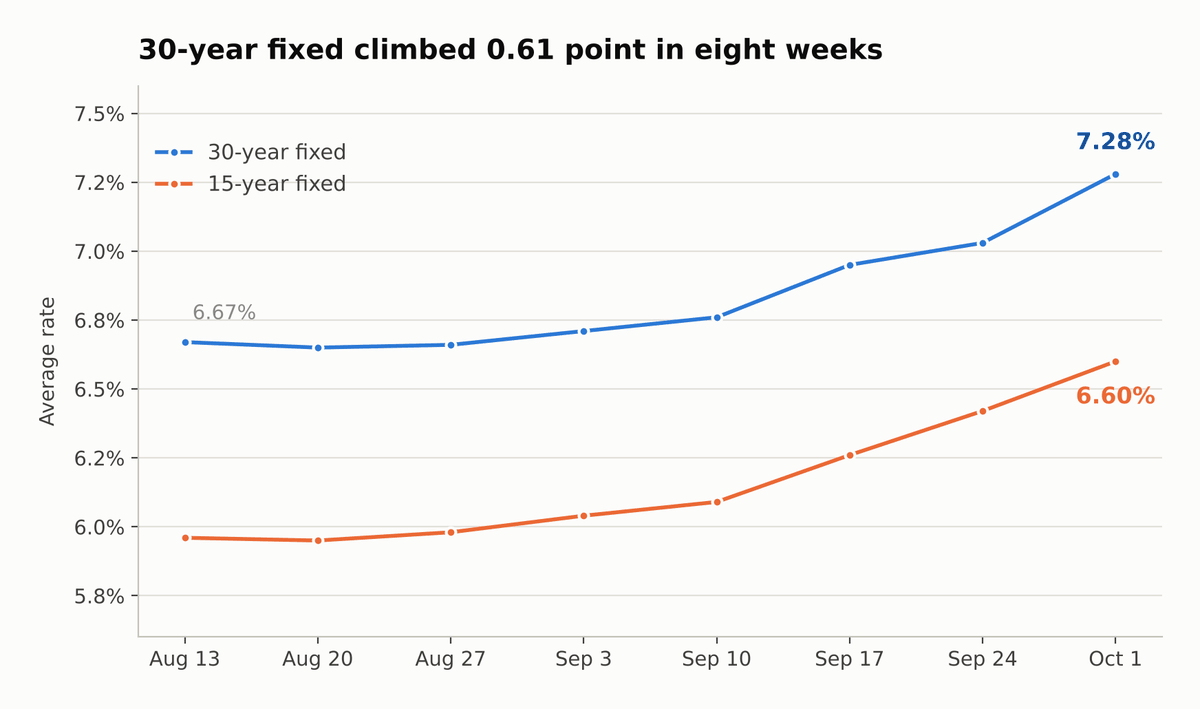
Figure 4. Freddie Mac weekly average mortgage rates, August 13 – October 1, 2026. Source: Freddie Mac Primary Mortgage Market Survey, released October 1, 2026.
What this costs in real dollars
The national median price for an existing home was $429,100 in August, per the National Association of Realtors. With 20% down, that’s a loan of $343,280.
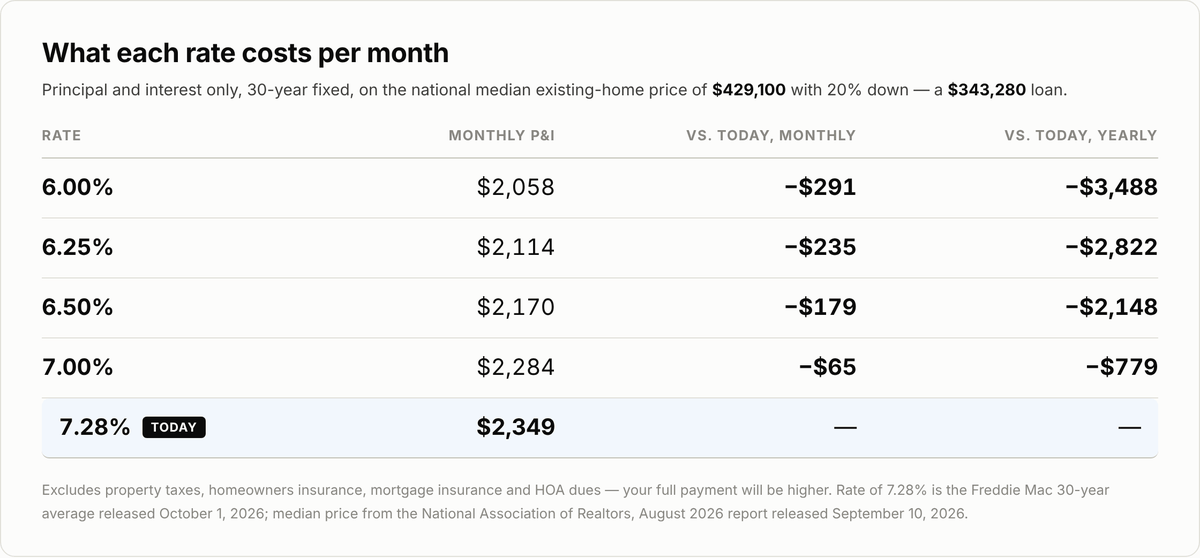
Figure 5. Monthly principal and interest by rate. Rate of 7.28% from Freddie Mac PMMS, October 1, 2026; median price from the National Association of Realtors existing-home sales report for August 2026, released September 10, 2026.
At today’s 7.28% average, principal and interest on that loan runs $2,349 a month. A year ago, when the average was 6.34%, the same loan cost $2,134 — so the same house now costs $215 more every month, or about $2,580 a year.
Looked at the other way: if rates came back down to 6.50%, that payment drops by $179 a month. That’s the prize if you’re waiting. It’s real, but it’s smaller than most people expect — and nobody can tell you when or whether it arrives.
One note on the table: these are principal-and-interest figures only. Your actual payment will also include property taxes, homeowners insurance, mortgage insurance if you put down less than 20%, and HOA dues if you have them.
The housing market, briefly
Higher rates are cooling things off, and that cuts in your favor if you’re buying.
Existing-home sales ran at a 3.98 million annual pace in August, down 2.0% from July (NAR).
There were 1.62 million homes for sale, up 5.9% from a year earlier — a 4.9-month supply, which NAR called the highest in over a decade.
Homes sat 31 days on the market, and first-time buyers made up 30% of sales, up from 28% a year ago.
Mortgage applications fell 6% in the last week of September, with refinances down 9% (Mortgage Bankers Association).
Translation: fewer buyers are competing with you, sellers are waiting longer, and you have room to negotiate on price, repairs, and closing costs in a way you simply did not three years ago. Prices are still rising, but barely — the median was up just 1.6% from a year ago.
What to watch this week
Wednesday, 2:00 p.m. ET — the Fed releases the minutes of its September meeting. We’ll learn how close the vote was and how worried officials are about jobs versus inflation. This is the week’s biggest event for rates.
Thursday — weekly unemployment claims, plus the University of Michigan’s first read on October consumer sentiment.
Tuesday, October 14 — the September inflation report. This is the one that matters most. If energy prices keep easing, it could be the first genuinely good news rates have had in two months.
October 27–28 — the Fed’s next decision.
What I’d do
If you’re buying right now: get an actual quote rather than going off the national average. The 7.28% figure is a survey of borrowers with strong credit and 20% down; your number could be better or worse. And ask me about a float-down option — it lets you lock today and still capture a drop if one comes.
If you’re sitting on a rate above 7%: let’s run the refinance break-even now, so you already know your target number. When a window opens in a market like this one, it does not stay open for weeks.
If you’re waiting for 6%: be honest about the trade. Waiting might save you $179 a month at 6.50% — but you’re competing against fewer buyers today than you will be if rates fall and everyone comes back at once. Inventory is the highest it’s been in over a decade. That advantage is worth something too.
Nobody knows where rates go from here, and anyone who tells you otherwise is guessing. What I can do is run your actual numbers, both ways, so that when you decide, you’re deciding on arithmetic instead of headlines.
References
Freddie Mac. Primary Mortgage Market Survey — Mortgage Rates Average 7.28%. Released October 1, 2026. freddiemac.com/pmms
U.S. Bureau of Labor Statistics. The Employment Situation — September 2026. Released October 2, 2026. bls.gov/news.release/empsit.nr0.htm
U.S. Bureau of Labor Statistics. Consumer Price Index — August 2026. Released September 11, 2026. bls.gov/news.release/cpi.nr0.htm
Board of Governors of the Federal Reserve System. Federal Reserve issues FOMC statement. Released September 16, 2026. federalreserve.gov
Board of Governors of the Federal Reserve System. Statistical Release H.15 — Selected Interest Rates. Data through October 2, 2026. federalreserve.gov/releases/h15
Board of Governors of the Federal Reserve System. FOMC Meeting Calendars. Accessed October 6, 2026. federalreserve.gov/monetarypolicy
National Association of Realtors. Existing-Home Sales Report — August 2026. Released September 10, 2026. nar.realtor/newsroom
Mortgage Bankers Association. Weekly Applications Survey, week ending September 25, 2026. Released October 1, 2026. mba.org/news-and-research
AAA. National Average Dips Following Record-Setting September. Released October 1, 2026. gasprices.aaa.com
CME Group FedWatch rate-probability data, as reported by Invezz, How Fed hike odds plunged from 70% to below 20% in one week, October 3, 2026. invezz.com
All five figures were produced in-house from the published data cited above. They are original work, free for you to reproduce and redistribute under your own brand. No AI-generated imagery is used anywhere in this issue. Any optional photo slot should be filled from a free-license source such as Unsplash, Pexels or Pixabay, or from U.S. federal government photography, which is generally public domain — with credit recorded in the slot.