
Daily Rate Commentary
Inflation Didn't Budge This Morning — Here's What That Means for Your Rate
Wednesday, August 26, 2026 at 9:20 AM PDT
The Fed's favorite inflation gauge held at 3.3% in July. Mortgage rates barely blinked. Below: what today's number actually changes for you, the one thing that's been pushing rates around more than the Fed lately, and what a quarter of a point costs in real dollars.
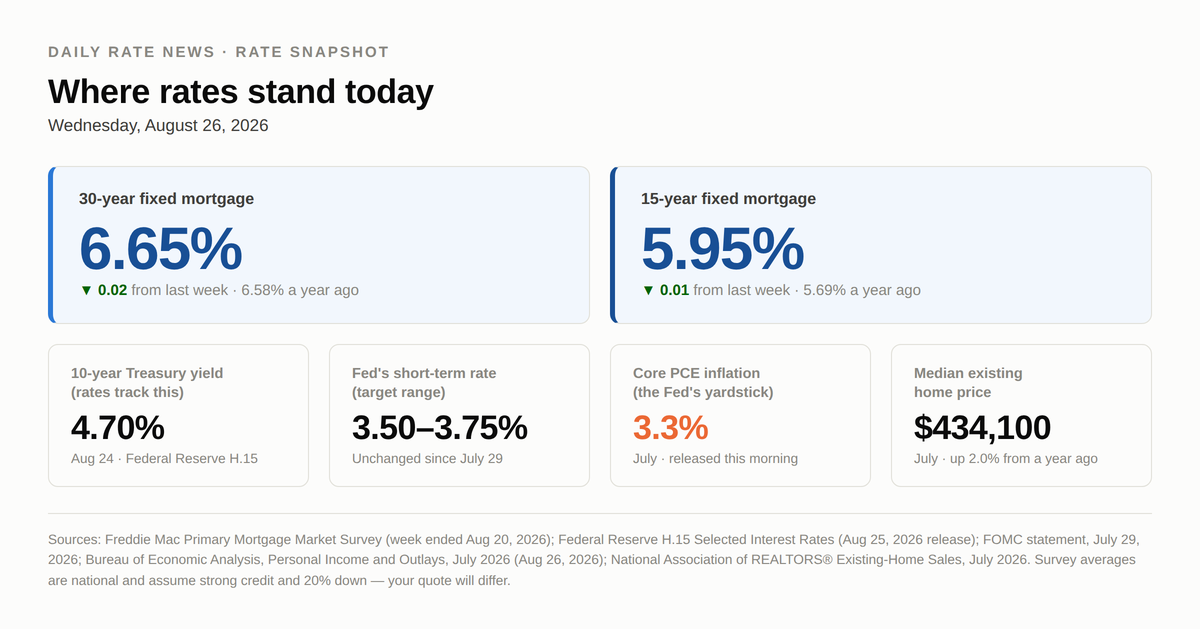
Figure 1. Rate snapshot for Wednesday, August 26, 2026. Sources: Freddie Mac Primary Mortgage Market Survey (week ended August 20, 2026); Federal Reserve H.15 (August 25, 2026 release); FOMC statement of July 29, 2026; Bureau of Economic Analysis, Personal Income and Outlays, July 2026 (released August 26, 2026); National Association of REALTORS® Existing-Home Sales, July 2026.
The number that landed at 8:30 this morning
At 8:30 a.m. Eastern, the Bureau of Economic Analysis published its Personal Income and Outlays report for July. Tucked inside is the figure the Federal Reserve watches more closely than any other: the core PCE price index. That's the price of everything Americans buy, minus food and energy — the two categories that swing so wildly month to month that economists set them aside to see the underlying trend.
It rose 0.2% in July, and 3.3% over the past 12 months. That's exactly where it sat a month ago. Including food and energy, prices were up 3.7% over the year.
The Fed's target is 2%. So the honest read on this morning's report is: no progress. Prices are still climbing at well over the pace the Fed says it will tolerate, and that is the single biggest reason mortgage rates in the 6s have been so stubborn.
The same report showed Americans' incomes up 0.4% in July while spending rose only 0.2% — and after adjusting for those higher prices, spending was essentially flat. The savings rate sits at 3.0%. Separately, the BEA confirmed the economy grew at a 1.5% annual pace in the second quarter, down from 2.1% in the first.
Why your rate didn't jump on the news
Here's the part that surprises people: rates barely moved.
That's because mortgage rates don't respond to headlines. They follow the 10-year Treasury yield — what investors demand to lend the U.S. government money for a decade. When that yield rises, mortgage rates follow within days; when it falls, they ease. It closed at 4.70% on August 24, per the Federal Reserve's H.15 release.
Investors had already assumed inflation would come in near 3.3%. When a number lands where the market expected, nothing has to reprice. The move happens on the surprise, not the level.
Right now the thing pushing rates around day to day isn't the Fed — it's the price of oil. Energy costs were up 14.7% over the 12 months ending in July, according to the Bureau of Labor Statistics. That one category is doing nearly all the work in the headline inflation number. Strip it out and core consumer prices rose just 2.5%.
U.S. crude oil traded near $80 a barrel Wednesday, down about 2% on the day and roughly 25% higher than a year ago, on reports of easing U.S.–Iran tensions. Mortgage News Daily noted Tuesday that “fuel prices continue dictating most of the day-to-day momentum for interest rates.” When oil slips on peace headlines, rates get a little better. When it spikes, they get worse — fast.
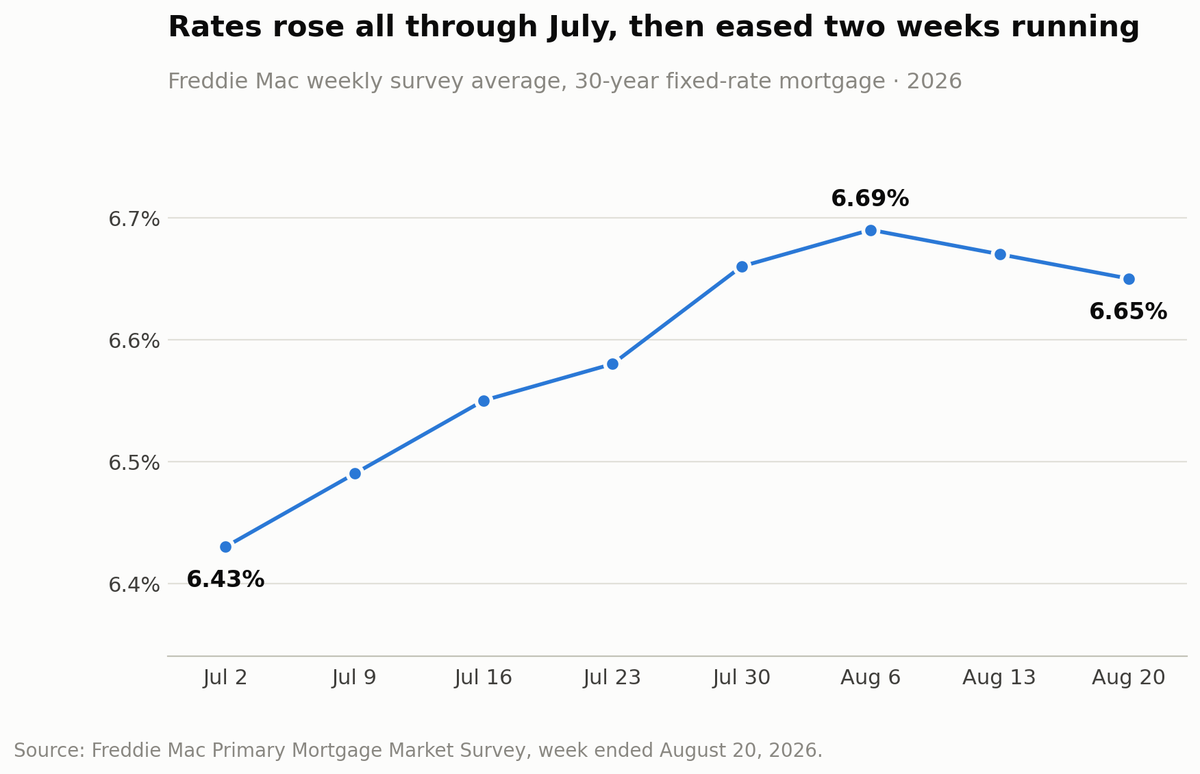
Figure 2. Twelve-month change in consumer prices by category. Source: U.S. Bureau of Labor Statistics, Consumer Price Index — July 2026, released August 12, 2026.
Where rates actually are
Freddie Mac's weekly survey put the 30-year fixed at 6.65% for the week ended August 20 — down from 6.67% the week before, and the second straight weekly decline. The 15-year fixed averaged 5.95%. A year ago those numbers were 6.58% and 5.69%, so you're paying slightly more than last August, not less.
Sam Khater, Freddie Mac's chief economist, made a point worth repeating: with rates dipping, “it's important to remember borrowers can potentially save thousands by shopping around.”
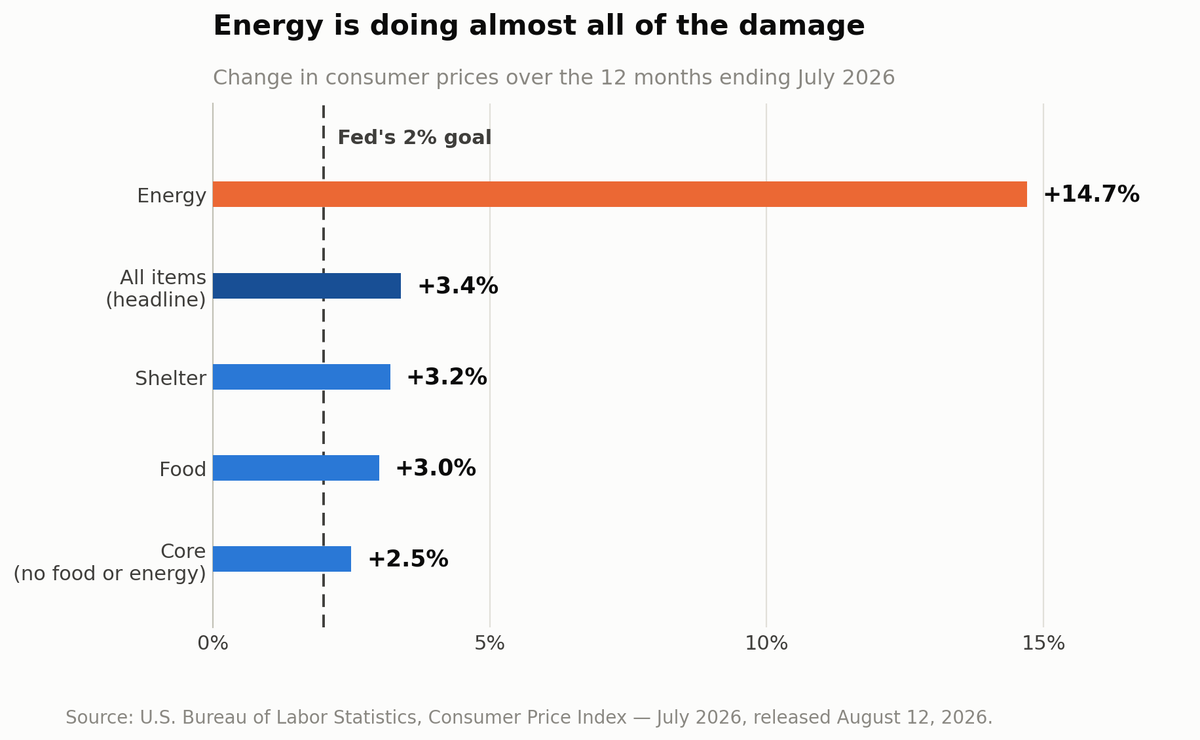
Figure 3. Weekly 30-year fixed-rate mortgage average, July 2 – August 20, 2026. Source: Freddie Mac Primary Mortgage Market Survey, week ended August 20, 2026.
What a quarter point actually costs
Percentages are abstract. Dollars aren't.
The median existing home sold for $434,100 in July, per the National Association of REALTORS®. Put 20% down and you're financing $347,280 over 30 years.
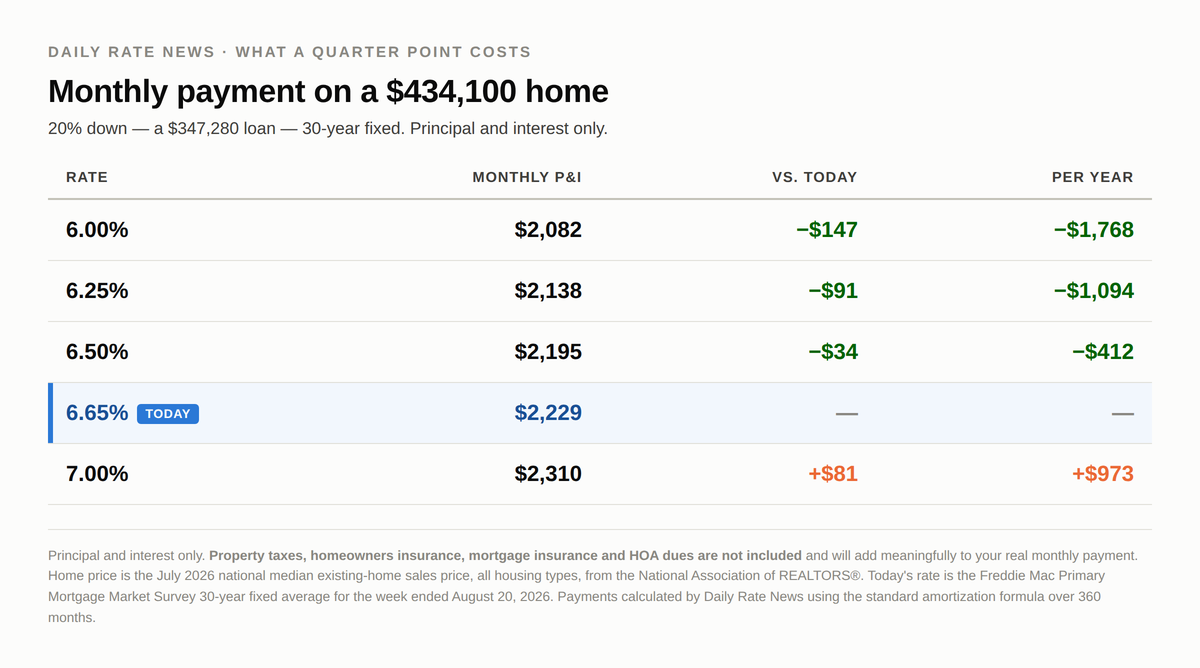
Figure 4. Monthly principal and interest at selected rates on the July 2026 national median existing-home price. Sources: National Association of REALTORS® Existing-Home Sales, July 2026; Freddie Mac PMMS, week ended August 20, 2026; payments calculated by Daily Rate News.
Each quarter-point step is worth about $57 a month — roughly $680 a year on a loan that size. Getting from today's 6.65% down to 6.00% would save about $147 a month, or $1,768 a year. Drifting up to 7.00% costs about $81 a month.
That's the whole case for not obsessing over an eighth of a point while ignoring lender fees — and also the case for shopping more than one lender. The spread between the best and worst quote you get will often be larger than anything the Fed does this fall.
The housing market in one paragraph
Existing-home sales ran at a 4.06 million annual pace in July, down 1.7% from June but up 0.7% from a year ago. There were 1.54 million homes for sale — a 4.6-month supply, unchanged from a year ago. As a rule of thumb, four to six months is considered a reasonably balanced market, which is a real change from the frantic conditions of a few years back. New construction is looser still: builders sold 607,000 homes at an annual rate in July, down 10.5% in a month, with a 9.6-month supply on hand and a median price of $393,800 (Census Bureau). Translation: builders have inventory and motivation, and that's where buydowns and concessions live right now.
What to watch the rest of this week
Thursday: weekly jobless claims, 8:30 a.m. ET.
Friday: the Labor Department's preliminary benchmark revision to payroll employment. This matters more than usual — July payrolls actually fell by 23,000, and May and June were revised down by a combined 103,000. A weak labor market argues for lower rates.
Friday, 10 a.m. ET: Fed Chair Kevin Warsh delivers his first Jackson Hole address since being sworn in this May. The symposium's announced theme is financial innovation and payments, not interest rates, so a policy signal isn't guaranteed — but markets will listen anyway.
September 15–16: the next Fed meeting. Note the direction of the risk: three Fed officials dissented in July in favor of raising rates. FXStreet, citing the CME FedWatch tool, put the odds of a quarter-point hike in September at 38% on Wednesday, down from 55% a month earlier. A cut is essentially not on the table.
What I'd do
Closing within 30 days? Lock. Rates are in a narrow range, and Friday carries two events that could break it either direction.
Sixty to ninety days out? Ask me about a lock with a float-down, so a genuine rally still helps you.
Sitting on a rate that starts with a 7? Let's run your break-even — divide your closing costs by your monthly savings and see how many months it takes to come out ahead. If you're staying past that date, it's worth a look even at 6.65%.
Shopping for a home? Ask about seller-paid or builder-paid rate buydowns before you ask for a price cut. On new construction especially, that's where the money is right now.
Want your actual numbers — your price, your credit, your down payment? Reply to this email or give me a call. No obligation, no pressure.
REFERENCES
U.S. Bureau of Economic Analysis. Personal Income and Outlays, July 2026. Released August 26, 2026. https://www.bea.gov/news/2026/personal-income-and-outlays-july-2026
U.S. Bureau of Economic Analysis. Gross Domestic Product (Second Estimate) and Corporate Profits, 2nd Quarter 2026. Released August 26, 2026. https://www.bea.gov/data/gdp/gross-domestic-product
U.S. Bureau of Labor Statistics. Consumer Price Index — July 2026. Released August 12, 2026. https://www.bls.gov/news.release/cpi.nr0.htm
U.S. Bureau of Labor Statistics. Employment Situation — July 2026. Released August 7, 2026. https://www.bls.gov/news.release/empsit.nr0.htm
Freddie Mac. Primary Mortgage Market Survey — Mortgage Rates Decline for Second Consecutive Week. Released August 20, 2026. https://www.freddiemac.com/pmms
Board of Governors of the Federal Reserve System. H.15 Selected Interest Rates (Daily). Release dated August 25, 2026. https://www.federalreserve.gov/releases/h15/
Board of Governors of the Federal Reserve System. FOMC Statement. July 29, 2026. https://www.federalreserve.gov/newsevents/pressreleases/monetary20260729a.htm
National Association of REALTORS®. Existing-Home Sales, July 2026. Released August 11, 2026. https://www.nar.realtor/newsroom/nar-existing-home-sales-report-shows-1-7-decrease-in-july
U.S. Census Bureau and U.S. Dept. of Housing and Urban Development. New Residential Sales, July 2026. Released August 25, 2026. https://www.census.gov/construction/nrs/pdf/newressales.pdf
Federal Reserve Bank of Kansas City. 2026 Jackson Hole Economic Policy Symposium.Announced August 25, 2026. https://www.kansascityfed.org/research/jackson-hole-economic-symposium/
FXStreet, citing the CME FedWatch Tool. Core PCE inflation holds steady at 3.3% in July as expected. August 26, 2026. https://www.fxstreet.com/news/us-core-pce-inflation-set-to-keep-pressure-on-the-federal-reserve-to-hike-interest-rates-202608260800
Mortgage News Daily. Mortgage Rates. August 25, 2026. https://www.mortgagenewsdaily.com/mortgage-rates
Trading Economics. Crude Oil. Accessed August 26, 2026. https://tradingeconomics.com/commodity/crude-oil
All four figures were created originally for this issue from the published data cited above and are free for you to reproduce in your own newsletter. No AI-generated imagery is used anywhere in this issue — every graphic is a chart or table computed from official figures. If you add a photograph, free-license options include Unsplash, Pexels and Pixabay; photography produced by U.S. government agencies is generally in the public domain.