Daily Rate Commentary
The Scariest Inflation Number in Months Was Mostly Just Gasoline
Saturday, October 17, 2026 at 1:05 PM PDT
Inflation ran at 3.7% in September — the highest reading this year since May. That sounds like terrible news for mortgage rates. Instead, bond yields fell for two straight days afterward. Here’s why the market looked past the headline, and what it means for your payment.
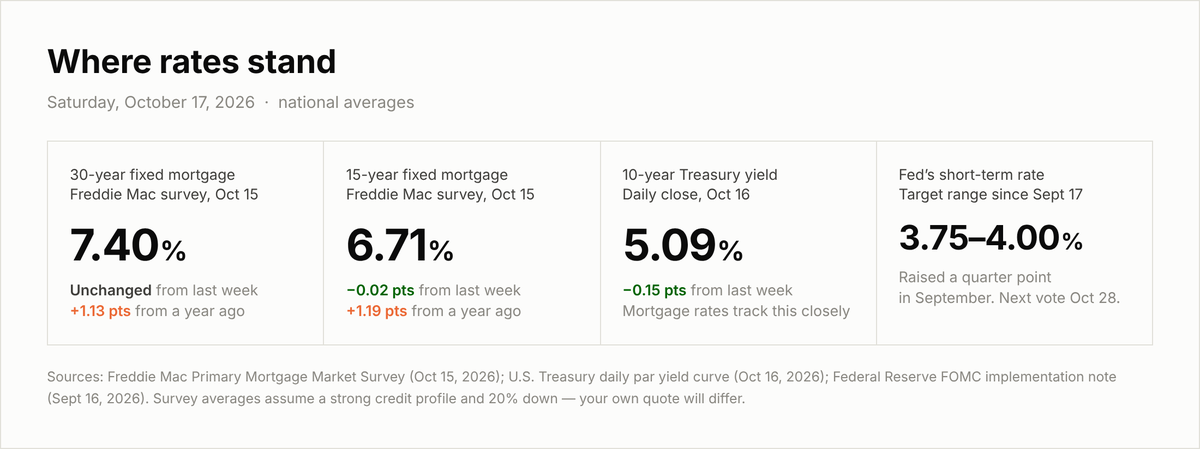
Figure 1. Rate snapshot as of Saturday, October 17, 2026. Sources: Freddie Mac Primary Mortgage Market Survey (October 15, 2026); U.S. Treasury daily par yield curve (October 16, 2026); Federal Reserve FOMC implementation note (September 16, 2026).
What happened on Wednesday
The Bureau of Labor Statistics released the September Consumer Price Index — the government’s main measure of how fast prices are rising — on Wednesday, October 14.
The number was ugly at first glance. Prices across the economy rose 0.6% in a single month and 3.7% over the past twelve months. That 3.7% is the highest since May, going by each month’s first published report.
Normally that is the kind of number that sends mortgage rates straight up. Lenders hate inflation, because inflation eats the value of the money you pay them back with over thirty years.
But look at what was inside the report.
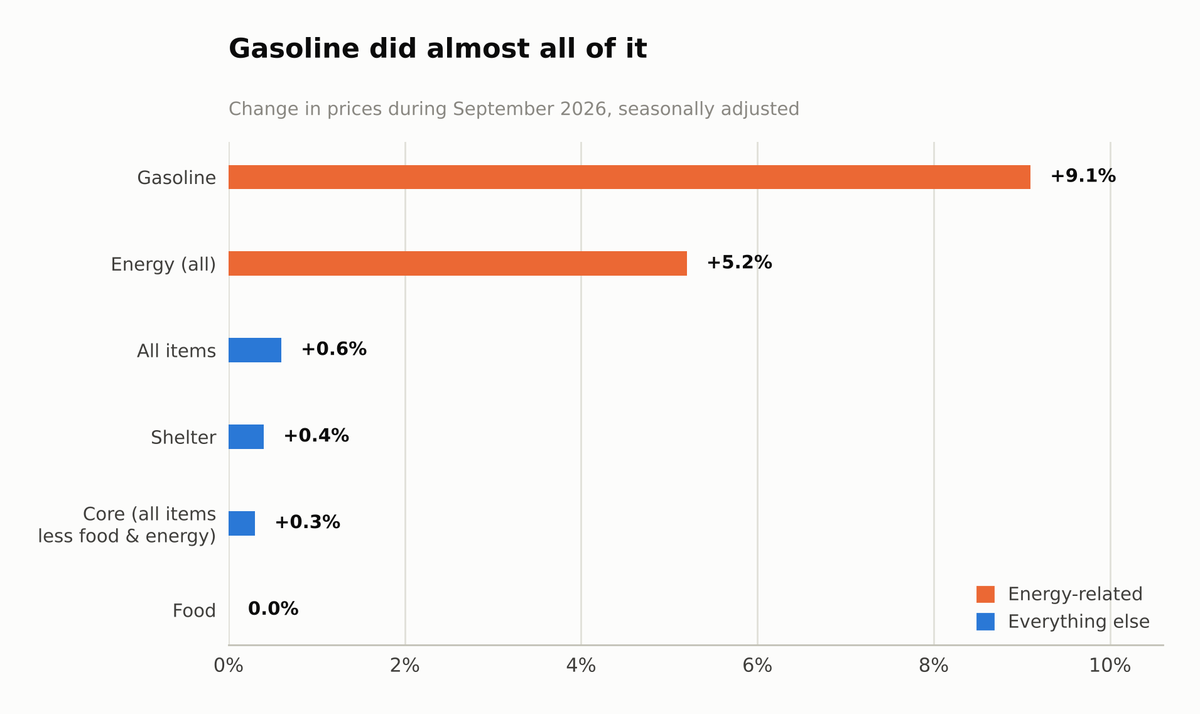
Figure 2. Change in consumer prices during September 2026, seasonally adjusted. Source: U.S. Bureau of Labor Statistics, Consumer Price Index — September 2026, released October 14, 2026.
Gasoline jumped 9.1% in one month. The BLS said gasoline alone accounted for more than half of the entire monthly increase. Energy overall rose 5.2%. Food didn’t move at all.
Strip out food and energy — the two categories that swing wildly month to month — and you get what economists call core inflation. Core prices rose just 0.3% in September and 2.6% over the year. That is not a number that frightens anybody.
Why the bond market shrugged
Mortgage rates don’t follow the Federal Reserve directly. They follow the 10-year Treasury bond — where big investors park money for the long haul. When demand for those bonds rises, their yield falls, and mortgage rates usually follow within days.
Investors came to a reasonable conclusion: a gasoline spike is a gasoline spike. Oil prices move for their own reasons, and they move back. What Americans pay for rent, cars, clothes and services barely budged.
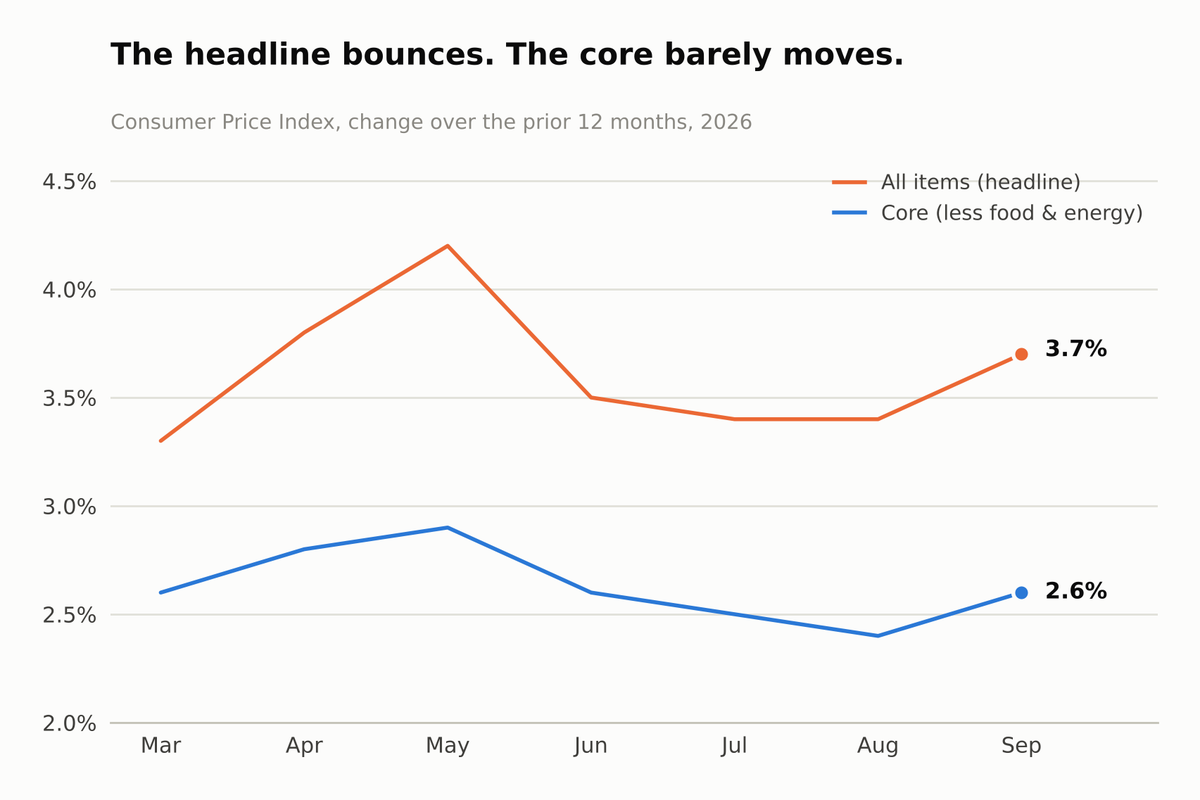
Figure 3. Consumer Price Index, change over the prior 12 months, March through September 2026. Source: U.S. Bureau of Labor Statistics monthly CPI news releases (first published figures).
You can see the pattern above. The orange line — the headline number everybody quotes — bounces around. The blue line underneath it, core inflation, has stayed in a narrow band between 2.4% and 2.9% all year long.
The bond market watches the blue line.
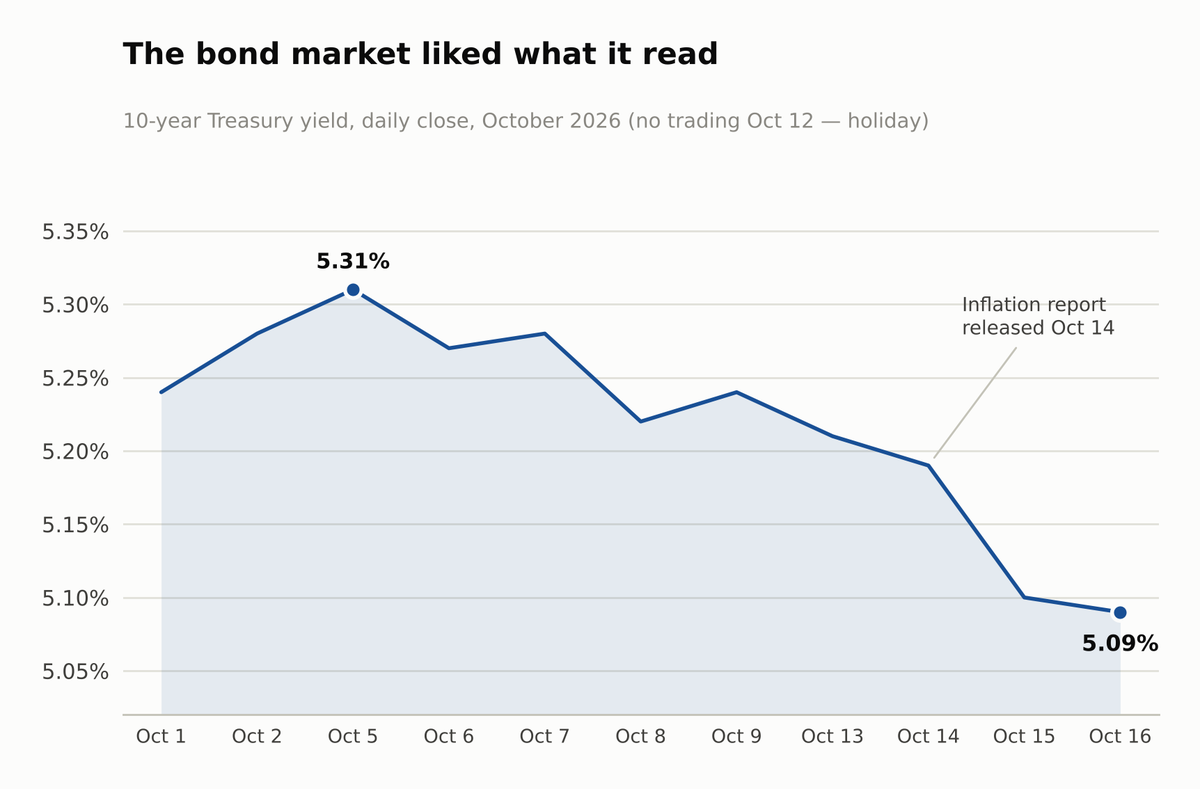
Figure 4. 10-year Treasury yield, daily close, October 2026. Source: U.S. Department of the Treasury, daily par yield curve rates. Markets were closed October 12 for the holiday.
The 10-year Treasury yield closed at 5.19% on the day the report came out. It fell to 5.10% on Thursday and 5.09% on Friday. That is roughly a tenth of a percentage point lower in two days, and it is more than two-tenths below where the yield sat on October 5.
The inflation report that was supposed to push rates up actually pushed them down.
One catch worth knowing: Freddie Mac’s weekly survey, which came out Thursday and showed the 30-year fixed holding at 7.40%, is an average gathered across the whole week. Thursday and Friday’s improvement may not show up until next week’s reading.
What this costs in real dollars
Rate talk is abstract until you put a payment next to it.
The national median existing-home price in September was $417,500, according to the National Association of Realtors. Put 20% down and you’re financing $334,000.
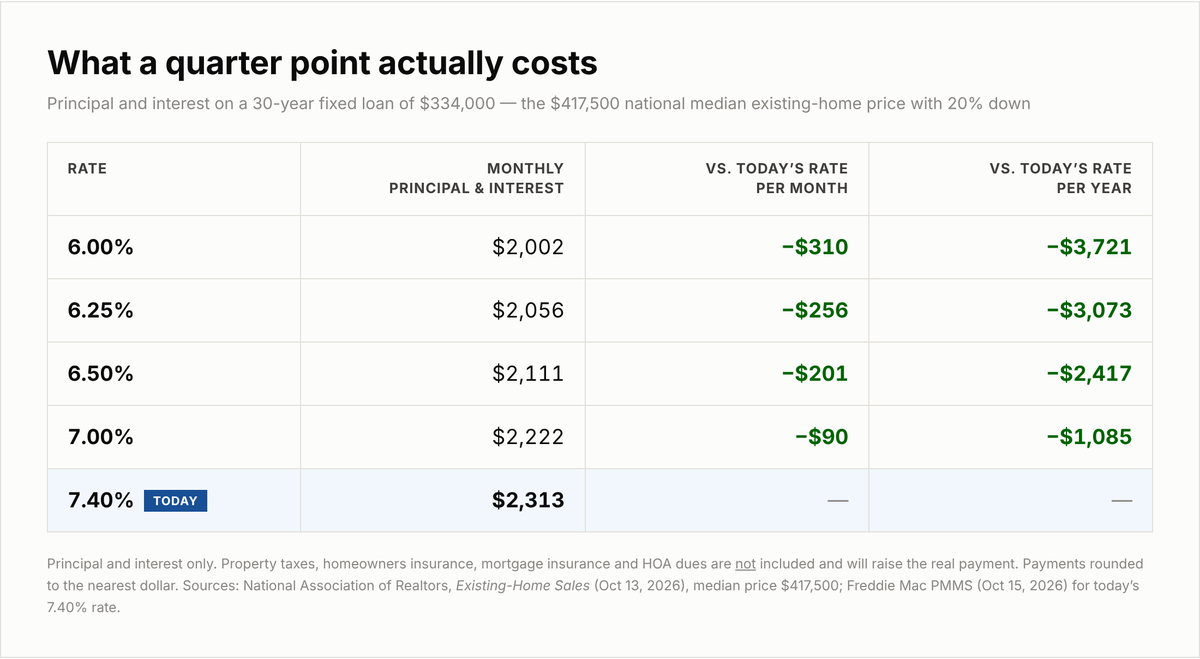
Figure 5. Monthly principal and interest on a $334,000 30-year fixed loan at several rates. Sources: National Association of Realtors, Existing-Home Sales (October 13, 2026); Freddie Mac PMMS (October 15, 2026). Taxes, insurance, mortgage insurance and HOA dues excluded.
At today’s 7.40%, that’s $2,313 a month in principal and interest. If rates fell to 7.00%, you’d pay $2,222 — about $90 less a month, or $1,085 a year. Get down to 6.50% and the payment is $2,111, saving roughly $200 a month.
For perspective on how far we’ve come: a year ago the 30-year fixed averaged 6.27%. That same loan would have cost $2,061 a month. Today’s buyer pays about $252 more every month for the identical house at the identical price.
That gap is the whole story of this housing market.
The housing market right now
The National Association of Realtors reported on October 13 that existing-home sales rose 1.5% in September to an annual pace of 3.99 million. That’s still 2.2% below last September.
The useful details are underneath that headline:
Inventory is up. 1.60 million homes were for sale, a 4.8-month supply. Six months is generally considered a balanced market, so we’re closer to balanced than we’ve been in years.
Homes sit longer. The typical listing took 33 days to go under contract.
Prices are barely rising. The median was up just 1.3% from a year ago — slower than inflation, which means homes got slightly cheaper in real terms.
First-time buyers made up 31% of sales.
NAR’s chief economist Lawrence Yun put it plainly: “Higher inventory and lengthening days on market give buyers improved negotiating power.” He also noted that August and September were the two slowest months for home sales this year.
High rates are the price of admission, but the leverage has moved toward the buyer.
What to watch this coming week
A quiet calendar, with one real event:
Monday: Homebuilder sentiment index, expected
Tuesday: Housing starts and pending home sales for September
Thursday: Weekly unemployment claims
Friday: Business activity surveys and the final University of Michigan consumer sentiment reading
Fed officials have gone quiet. Their self-imposed blackout started today and runs through October 29, so there will be no surprise speeches this week.
The main event is Wednesday, October 28, when the Fed announces its next decision. The Fed raised its short-term rate a quarter point in September, to a target range of 3.75%–4.00%. Futures traders put the odds of no change at the October meeting at roughly two in three, according to CME FedWatch data cited by Forbes on October 14.
Remember: the Fed’s rate is not your mortgage rate. What the Fed signals about the months ahead matters more.
What I’d do if you’re my client
If you’re under contract, this week’s bond improvement is worth a phone call. If pricing moved in your favor since you locked, a float-down may be available. If you haven’t locked, we should talk before the 28th — Fed days can go either direction fast.
If you’re shopping, don’t let 7.40% freeze you. That’s a national average for a borrower with strong credit and 20% down; your quote depends on your credit, your down payment and the loan you choose. With inventory up and homes sitting a month, the room you have to negotiate on price may be worth more than a quarter point on the rate.
If you’re thinking about refinancing, the math is simple: take your closing costs, divide by the monthly savings, and that’s how many months until you break even. If you plan to stay past that point, it works. If not, it doesn’t.
If you own and you’re staying put, there’s nothing to do this week.
Call me and we’ll run your actual numbers. That takes fifteen minutes and it beats guessing.
Want your actual numbers?
Fifteen minutes on the phone beats a week of guessing. I will run your scenario at today’s pricing — no obligation.
REFERENCES
1. U.S. Bureau of Labor Statistics. Consumer Price Index — September 2026. October 14, 2026. https://www.bls.gov/news.release/archives/cpi_10142026.htm
2. U.S. Bureau of Labor Statistics. Consumer Price Index monthly news releases, March–August 2026. first published figures. https://www.bls.gov/bls/news-release/cpi.htm
3. Freddie Mac. Primary Mortgage Market Survey. week ending October 15, 2026. https://www.freddiemac.com/pmms
4. U.S. Department of the Treasury. Daily Treasury Par Yield Curve Rates. data through October 16, 2026. https://home.treasury.gov/resource-center/data-chart-center/interest-rates/TextView?type=daily_treasury_yield_curve
5. Board of Governors of the Federal Reserve System. H.15 — Selected Interest Rates (Daily). October 16, 2026. https://www.federalreserve.gov/releases/h15/
6. Board of Governors of the Federal Reserve System. FOMC Statement and Implementation Note. September 16, 2026. https://www.federalreserve.gov/newsevents/pressreleases/monetary20260916a.htm
7. Board of Governors of the Federal Reserve System. FOMC Meeting Calendar.accessed October 17, 2026. https://www.federalreserve.gov/monetarypolicy/fomccalendars.htm
8. Board of Governors of the Federal Reserve System. FOMC Blackout Period Calendar.accessed October 17, 2026. https://www.federalreserve.gov/monetarypolicy/files/fomc-blackout-period-calendar.pdf
9. National Association of Realtors. Existing-Home Sales — September 2026. October 13, 2026. https://www.nar.realtor/newsroom/existing-home-sales-increased-1-5-in-september-according-to-nar-report
10. Forbes. Fed 66% Likely To Hold Rates Steady Following High Inflation Data. October 14, 2026. https://www.forbes.com/sites/digital-assets/2026/10/14/fed-66-likely-to-hold-rates-steady-following-high-inflation-data/
11. The Conference Board. U.S. Leading Economic Index. next release October 22, 2026. https://www.conference-board.org/topics/us-leading-indicators
12. S&P Global. Flash US PMI release schedule. October 23, 2026. https://www.pmi.spglobal.com/Public/Release/ReleaseDates
About the figures. All five figures were built from the published data cited in their captions. They are original, contain no AI-generated imagery, and you are free to reproduce them in your own newsletter. Figures 1 and 5 were rendered from HTML; Figures 2, 3 and 4 from the source data in matplotlib.
One figure not verified. The NAHB homebuilder sentiment index is listed as expectedMonday, October 19. NAHB no longer publishes its October 2026 release date, so that date follows its usual pattern but is not confirmed by a primary source. Every other number in this issue was checked against the source named beside it.